- Click on an element to bring up its spectra in the two vertical windows.
- Mouse over the features to read off the wavelengths of those features
- Note that may more features are visible in Terrestrial Lab spectroscopy than in an actual stellar atmosphere. However, the wavelengths of the features are exactly the same.
If it fails to launch see this page
Set the temperature to 10,000 degrees.
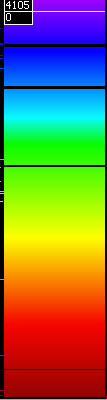
To the right is an example screen shot for element AX showing the 4 spectral lines (wavelengths omitted) that you would need to match up with the periodic table of elements. The white line at the top labelled 4105/0 is what you slide up and down to measure the wavelengths of the 4 dark lines. Your response to this question should include
- the wavelengths of the identified lines in AX and BX.
- Which element in the periodic table that you think corresponds to AX and BX (remember, AX and BX both are elements with atomic numbers less than 20)
Enter the four wavelengths for AX and BX into the RTF template in the appropriate column as well as your choice for elements, from the Periodic Table, that best correspond to AX and BX.
Question 2:
Refer to the picture to the right of A, B and C to answer the posed question.
| A) List all the possible values of photon energies that this atom can "emit" on its return to the ground state. |
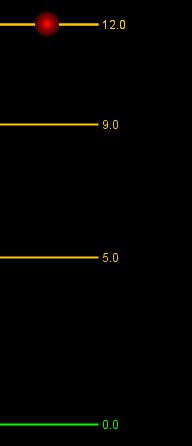 | B) An incoming photon has energy = 9 units. What will happen to the photon and the electron? |  | C) An incoming photon has energy = 5 units. What will happen to the photon and the electron? | 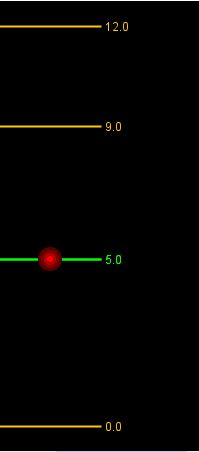 |
Question 3. This refers to the material in Module 3 Lecture A as related to the determination of stellar parallax by Tycho.
Open the simulation. (FLASH based)
At the bottom is your detector, in this case 3 independent pixels. The eye above reflects the orbit of the Earth around the Sun. The angle is the parallax angle. In order for a parallax to be detected, the Star has to move at least one independent pixel. In this default case, there is no detection - the star does not change pixels (the star is too far away and/or the resolution of the detector is too imprecise).
The course grid simulates measurements from the ground through our atmosphere.
The Fine Grid refers to measurements made from space.
Separation refers to distance from the Earth to the star; smaller values are larger distances.
-
a) With the course grid checked (i.e. 3 pixels), what is the required minimum separation (i.e. the distance to the star) to produce a detection. Increment the seperation by clicking on the arrows?
b) Leaving the separation at that minimum value, click on Fine Grid. How many pixels (e.g. resolution elements) of movement is there in this case?
c) Explain why space based observations offer a much better way of detecting stellar parallax than can be done from the ground.
Question 4
Here we will make use of simulators (FLASH based) to work with issues of the inverse square low and noisy data.
Open up Case 1 simulator Clicking on the starfield will produce a point on the graph; mouseover the points on the graph to read out the X,Y position. Y represents the received flux on the detector and X is the distance to the star. When the plot appears there will already be some points on it - just ignore those. They are merely testing if the plot is working.
-
Part A:
-
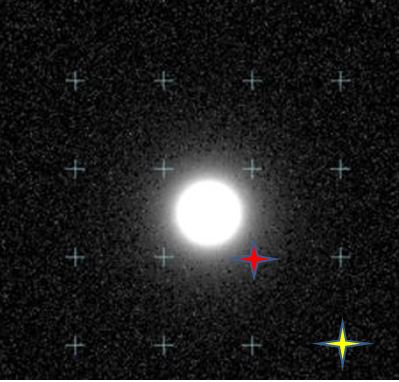 Make your first measurement at the approximte position indicated by the red mark in the figure (the actual simulaton doesn't contain this red mark). That should produce a point on the graph at an X,Y position of approximately X= 36 and Y = 62.5
- Make 5-8 additional measurements from those coordinates on a radius towards the center of the star until you reach the saturation level of Y=800.
- You have now populated the inverse square law curve by sampling the flux at a variety of distances. Paste a screen shot of the graph into the submission template.
- Now make additional measurements near the yellow mark (again a reference point in the figure, not in the simulation) and explain why you can no longer detect the star at that radius.
Open up Case 2 simulator
-
Part B:
- The luminosity of the star is the same as in Part A. What do you notice about both the star image and the points on the graph?
- Make many measurements in all the quadrants around the star and make a screen shot of your graph.
- Explain why in this case you don't see the inverse square law reflected in your graph.