Astronomy 122 Distance Education Third Homework Assignment
Homework submission template RTF
format (this should work for open office and other forms of "word")
When you have completed the template word document, upload it
Via this submission tool.
Note that
Different operating systems treat images differently and can produce very large files which are difficult to upload - to
avoid this problem:
a) For mac users - be aware that the Mac default screen capture software is TIFF format (stupidly large) - convert your screen captures to PNG files and they will be much smaller
b) if your still having trouble then upload the figures as separate documents.
Questions:
The HR diagram to the right shows the results for a sample of 1500 nearby stars with well measured parallaxes. The X-axis is in Units of the B-V color index and the Y axis is in units of solar luminosities (done as a log). The yellow block is the location of the SUN (B-V) ~ 0.65; L = 1.
The table below contains two samples of stars, A and B that have been selected by some criteria. Plot the two samples using this tool using the following instructions:
- Clear out all the data currently there by highlighting with cursor and hitting delete (the graph will also disappear)
- Select Dot as the plot option
- Type B-V in cell A1; Sample A in cell B1; Sample B in cell C1
- Type the value -0.1 on cell A2 and then increment column A by 0.1 until you reach a value of 1.2. You should then have a table that looks like this
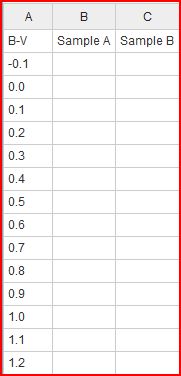
Now that you have the chart set up enter in the data for sample A and Sample B as shown below (note the data values for A and B at a given B-V are the log of the solar luminosity. So a star which is 100 times brighter than the sun would be entered here as log(100) = 2.0

|  |
Questions to answer in the template:
Looking at the graph:
a) What do you notice that is different about Sample A compared to Sample B?
b) How do you think Sample A was selected compared to Sample B?
c) What data point do you think likely represents a data error or
an incorrect measurement.
d) Paste an image of your into the template.
|
Answer these remaining questions on the template:
- Find some information about the white dwarf cooling curve. What
is the principal way that a white dwarf looses its energy? How can
the cooling curve be used to to determine the age of our Galaxy.
- Do some research on Brown Dwarf Stars.
- What are their principal properties?
- Should they in fact be considered as stars?
- Describe some of the expectations that these objects might have Earth like planets.
- Explain why stars are unstable (that means their Radius changes) when they are not generating energy in their cores:
- For low mass stars, the relation between their luminosity (intrinsic energy output) and their mass is the following:
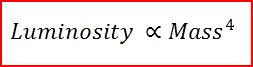
Which means luminosity is proportional to Mass to the 4th power. The main sequence lifetime of a star is found by its Mass (fuel) divided by the rate of fuel burn (Luminosity); hence lifetime = M/L where M and L are measured in solar units. A one solar mass star with one solar luminosity has M/L = 1/1 =1. The main sequence lifetime of a one solar star is 10 billion years. From that information answer the following and show all work on the template:
a) What is the M/L ratio for a 4 solar mass star?
b) What is the M/L ratio for a 0.1 solar mass star?
c) In terms of the M/L value, explain why low mass stars live much longer than high mass stars.