The HR diagram to the right shows the results for a sample of 1500 nearby stars with well measured parallaxes. The X-axis is in Units of the B-V color index and the Y axis is in units of solar luminosities (done as a log). The yellow block is the location of the SUN (B-V) ~ 0.65; L = 1.
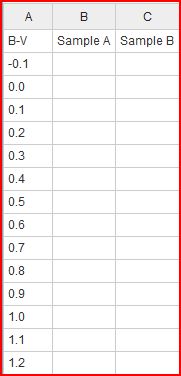
The table below contains two samples of stars, A and B that have been selected by some criteria. Plot the two samples using this tool using the following instructions:
|  |
| Questions to answer in the template: Looking at the graph:
b) How do you think Sample A was selected compared to Sample B? c) What data point do you think likely represents a data error or an incorrect measurement. d) Paste an image of your graphs into the template. |

- What are their principal properties?
- Should they in fact be considered as stars?
- Describe some of the expectations that these objects might have Earth like planets.
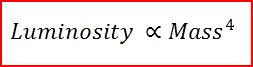
Which means luminosity is proportional to Mass to the 4th power. The main sequence lifetime of a star is found by its Mass (fuel) divided by the rate of fuel burn (Luminosity); hence lifetime = M/L where M and L are measured in solar units. A one solar mass star with one solar luminosity has M/L = 1/1 =1. The main sequence lifetime of a one solar star is 10 billion years. From that information answer the following and show all work on the template:
a) What is the M/L ratio for a 4 solar mass star?
b) What is the M/L ratio for a 0.1 solar mass star?
c) In terms of the M/L value, explain why low mass stars live much longer than high mass stars.