The Discovery of Universal Expansion

Figure 2.2 Schematic illustration
of the compression and/or stretching of light waves from a
moving source. Observer A would see a redshift while
Observer B would see a blueshift. The amount of shift depends
upon the velocity of the source.
|
By 1914, spectroscopic observations of galaxies by Slipher, had shown
the presence of emission or absorption lines that were shifted to
wavelengths longer than would be expected if the galaxy was at
rest. This phenomenon is known as a redshift and is explained by
the Doppler Effect which is illustrated in Figure 2.2.
A moving source which is emitting light at a constant wavelength
will be perceived differently by different observers. If the source
is moving towards the observer, the lightwaves will become bunched
in that direction and the observed wavelength will be less than the
emitted wavelength. If the source is moving away from the observer,
the lightwaves will become stretched along the line of sight and the
observer will measure a wavelength which is longer than the emitted
wavelength. This same principle applies to sound waves emitted by
a train or an siren where all of us have heard the change in pitch when
the source has moved by us. The amount that the light is shifted
depends only on the radial velocity of the object. This shift
is given by

A galaxy with Vr
(its radial velocity) of 3000 km/s will
show a shift of 1%, as the speed of light is 300,000 km/s. Thus, a
spectral line which has a rest wavelength of 6562 Angstroms would be
shifted by 65 Angstroms to the red and be observed at a wavelength of 6627
Angstroms.
Following up on Slipher's original work, Edwin Hubble and Milton Humason
began a systematic spectroscopic survey of galaxies and
again found that most galaxies exhibited a redshift, indicating radial motion
away from the observer.
Now we have a fundamental observation that most galaxies around us
are moving away from us. What does that imply? For one thing,
Hubble noticed that not all galaxies exhibited the same redshift as
might be expected if galaxies were fixed on some spherical shell (e.g.
a crystalline sphere) which
was moving away from us. This difference in observed redshift must indicate
that the amplitude of the redshift depends on some other property.
However, at the time galaxy redshifts were first being measured, there
was also a debate about the overall nature of these nebulae (galaxies).
There existed two possibilities, either a) these nebulae were part of
our own Galaxy and their redshifts were due to motion within the Galaxy,
or b) these nebulae were actually separate galaxies that lay at distances
far beyond the dimensions of the Milky Way. Until there was a way
to determine the distances to these nebulae, this debate did not
have a satisfactory resolution.
This dilemma culminated in the Shapley-Curtis debate in 1920. The
title of this debate was Scale of the Universe and like our ancient
ancestors it represented humanity once again struggling to find its
proper place in the Cosmos. At issue was the overall size of the
Universe. Shapley argued that the spiral nebulae Hubble and others
were measuring were just gas or dust clouds in our own Galaxy and
that, therefore, the Milky Way was the Universe. Curtis, however,
advanced the idea that these spiral nebulae were galaxies just like
our own which indicated that the Universe consisted of a sea of
individual galaxies. Each point of view had its merits and could
be supported by the data on hand at the time. Inadequate or ambiguous
data often is the reason for scientific debate and this is part of
the scientific process. The debate usually ends when sufficiently
good data arises to declare one side the winner.
This good data came in the form of Hubble's discovery of Cepheid
variables in the Andromeda Nebula (M31) in 1923. Using the 100-inch
Telescope at Mt. Wilson, Hubble took many photographic plates of
M31 and observed some of the brighter stars to vary in brightness
over time. By 1925, Hubble had sufficient data to show that these
variable stars were just like the Cepheid variables seen previously
in the Large Magellanic Cloud (LMC). The only difference was that, on
average, the Cepheids in M31 were 200-300 times fainter than those
in the LMC. This indicated that M31 had to be approximately 15 times
farther away than the LMC and therefore must be a large galaxy located
millions of light years from our own Galaxy.
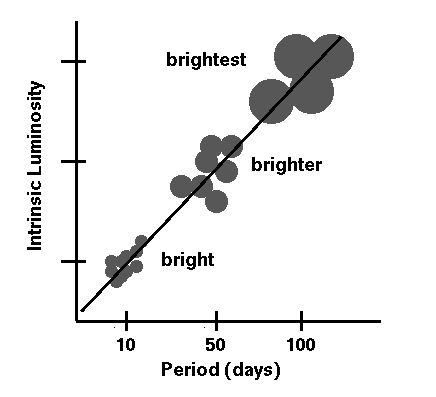
Figure 4.4 Schematic representation of
the relation between the period of pulsation and the luminosity
of a Cepheid. The most luminous Cepheids have physically larger
radii and correspondingly longer pulsational periods than the
lower luminosity Cepheids.
|
Cepheid
Variable:. These variable stars show a strong
relationship between their intrinsic luminosity and their period
of variation. This relationship is shown in Figure 4.4 and is
known as the period-luminosity (PL) relation. When the PL is calibrated,
the intrinsic luminosity of a Cepheid variable detected in another
galaxy can be determined by just measuring its period of variation.
As shown in Figure 4.4, the typical Cepheid has a period of 10-100
days with the longer period variables being the brightest.
Hubble made use of this PL relation
to determine the distance to M31 relative to the Large Magellanic
Cloud (LMC). However, before we can use the PL relation to derive
absolute distances, we must find a calibration for it. As a first
attempt we can try to determine the distances to stellar clusters
in our Galaxy that contain Cepheid variables.
Having now demonstrated that the spiral nebulae were indeed other
galaxies, then their observed redshifts reflected some form of
relative motion between the galaxies. But what could drive this
relative motion? Over time, Hubble acquired spectra of fainter
and smaller galaxies. He noticed that, in general, their observed
redshifts were significantly larger than were observed for bigger
and brighter galaxies. By assuming that all galaxies had the same
physical size or were of the same physical brightness, Hubble concluded
that the smaller and fainter galaxies appeared that way because they were
farther away. Hence, Hubble used the apparent size or apparent
brightness of a galaxy as a distance indicator.

| Figure 2.3
Hubble's original data plot which shows the correlation
between redshift and distance for his sample of galaxies. Although
the data is quite noisy, the overall trend is adequately
represented by a linear law which redshift is directly proportional
to distance. That law is depicted by the solid line.
|
When Hubble then plotted
the observed redshift versus the indicated distance he saw a
correlation. Although the original data is quite noisy (see Figure 2.3),
there is a tendency for the smaller, fainter galaxies to have larger
redshifts than the bigger, brighter galaxies. Thus, the farther away a
galaxy is, the greater its redshift will be. So this means that
distant galaxies are moving away from us at a faster rate than
nearby galaxies.
While Hubble did help resolve the distances to galaxies, this was
a point of considerable debate in the early part of the 20th century.
The key debate was between Shapely and Curtis