The Two Principle Problems with Energy Management:
 Failure for policy makers to understand the concept of exponential growth. Failure for policy makers to understand the concept of exponential growth.
 Failure for legislature to be formulated and passed to give us a long term
energy strategy that is sensible Failure for legislature to be formulated and passed to give us a long term
energy strategy that is sensible
|
The result of these failures is to create an escalating energy crises as time
continues to run out.
Unfortunately, most people are either oblivious to this or
believe that some new source of energy will magically appear.
|

Exponential growth drives resource usage for a very simple reason:
Human population increases exponentially:

Accurate trend extrapolation is the most important part of future
planning.
However, failure to assume exponential growth will always lead to
a disaster  so always assume exponential
growth when planning anything!
Exponential
Growth means that the percentage that something grows on an annual
basis is constant. That leads to the doubling time aspect of exponential
growth. so always assume exponential
growth when planning anything!
Exponential
Growth means that the percentage that something grows on an annual
basis is constant. That leads to the doubling time aspect of exponential
growth.
Doubing Time: 70/n years; n =% growth rate
Its important to recognize that even in the slow growth period,
the use of the resource is exponential. If you fail to realize
that, you will run out of the resource pretty fast.
Guassian Depletion Curve:
Whenever something grows exponentially against a finite resource, there
is a characteristic production curve that results. In Oil Depletion,
this is known as the Hubbert Curve.
Excel Spreadsheet Example
The Exponential Depletion Timescale:
Te = 1/k * ln (Rk/ro +1)
where k = growth rate
R = total resource available
ro = initial consumption rate
The basic problem is that we substitute Disney's First
Law (Wishing Makes it So). for this physical reality of resource depletion.
Some examples to do in Excel. While its not required that you do any of these, it would be
nonetheless useful to education yourself about a very important fact - resource
depletion timescales are driven far more strongly by the value of k (the
exponential growth rate), than the value of R (the total resource which
is available).
Calculate resource depletion time
scales for various values of k.
- Coal (US): R = 200 (billion tons) ro = 1 (2001)
- Natural Gas (US): R = 200 (tcf) ro = 22
Natural Gas (World): R=161 (tcm) ro = 2.5 (2002)
- US: R = 100; ro = 1; k = .03 and pretend its 1956 and
your now Hubbert . The value of k has
been determined from the last 6 years of data. R has been estimated.
ro is known.
Oil (World): R = 1000 ro = 28 (2001)
- Cooper (US): R = 45 (million tons) ro = 2 (1996)
World: R = 320 ro = 9
Now in the real world, consumption curves are modified by economics
and so may look something like this.
 And this makes trend extrapolation difficult.
However, in the case of resource usage (as opposed to market
economics), underlying exponential growth is usually the basis
for resource usage, unless some new technology comes into play
that makes the use of that resource more efficient.
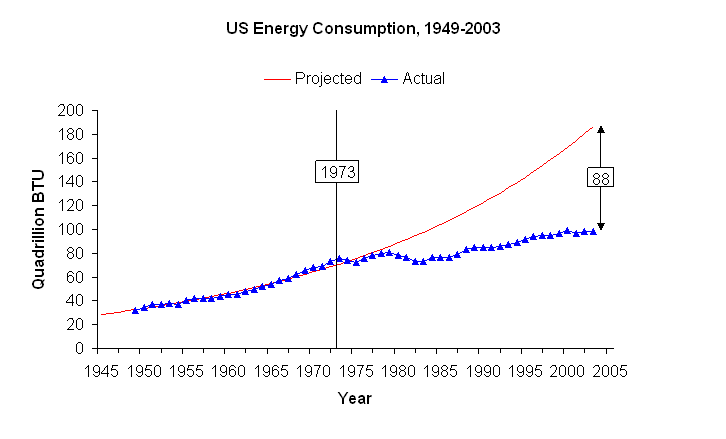
A good example of this is provided by the pattern of historical
energy consumption in the US.

Note that this energy usage above includes energy for heating,
cooking and transportation.
In more "modern" times, an increasing fraction of our energy use
is devoted to generating electricity:

| 
 Failure for policy makers to understand the concept of exponential growth.


