Primer on Crude Oil: Distribution, Inventories, and Prices
The following graph compares the price of crude oil (green) with the average price of a gallon of gas in the US (over the past year). Note how the offset between these two varies as time goes on. There is also evidence that crude oil price has stabilized.
So what is going on here? This is not supply and demand at work.
Well, for 1) the supply has essentially been constant sine 2005 as the refining infrastructure has maxed out (see material in Week 1. This is an extremely important point. It is physically impossible to increase supply (in terms of daily distribution) to significantly increase supply (say by 10%).
July 2008 saw a record in peak production (or peak supply) of 88 MBD(same time as when the gas prices
were highest ...). December 2008 saw a drop in supply down to 83 MBD which may reflect the lag time
between high prices and the demand for oil -
One therefore might
speculate that the amplitude of the monthly variations around the constant supply line (85 million barrels
per day) will fluctuate to +/- 3 MBD (or about 15% US daily consumption which is
significant). To smooth over these fluctuations the US needs to have a reserve.
When you read in the newspaper that "supply" is increasing this usually means that oil stocks (i.e. inventory) is increasing. This represents oil that is put into storage instead of the world wide daily refining system.
The units of storage are in days of available supply (given current consumption rates). It is this indicator of supply that shows fluctuations at the 10% level. Therefore, when you are told that the world oil supply has increased by 10% that refers to storage and not distribution. You can also see that we are not significantly increasing storage over time and, in fact, in absolute terms, have very little storage capacity (e.g. 2 months). However, over the period Jan 2008 to Jan 2009 it is true that we increased storage capacity by about 20% But this does not mean there is 20% more oil available to the world!
Okay, back now to supply and demand. What is really going on is related to the futures market and the future price of oil based on future speculation for demand. The problem here is that the physical distribution of the resource is already constrained - it can not support future demands (unless we build more refineries.). This ultimately leads to the following behavior of the futures market:
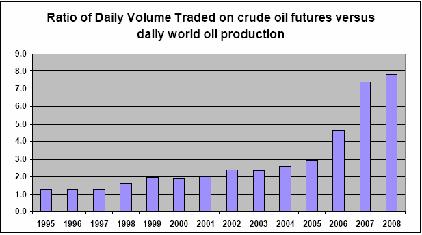
As time goes on, the ratio of futures volumes vs physical volumes is strongly increasing. In the year 2008, 8 times more oil was traded than could be physically used. According to the 60 minutes report, at the height of this insanity (June 2008), for every barrel that was physically used, 27 were traded.
You can see that prior to 2006, the futures trading ratio was 2-3 which is in the normal range for this kind of activity. For instance, in 1995, the ratio was about 1.2 and the refining infrastructure could easily increase to accomodate this factor of 1.2.
But starting in 2006, the ratio became increasingly unphysical (and unstable). Ultimately this dramatically drove up the price of oil because it was now an artifical price that had no physical correspondence to the actual use of the product.
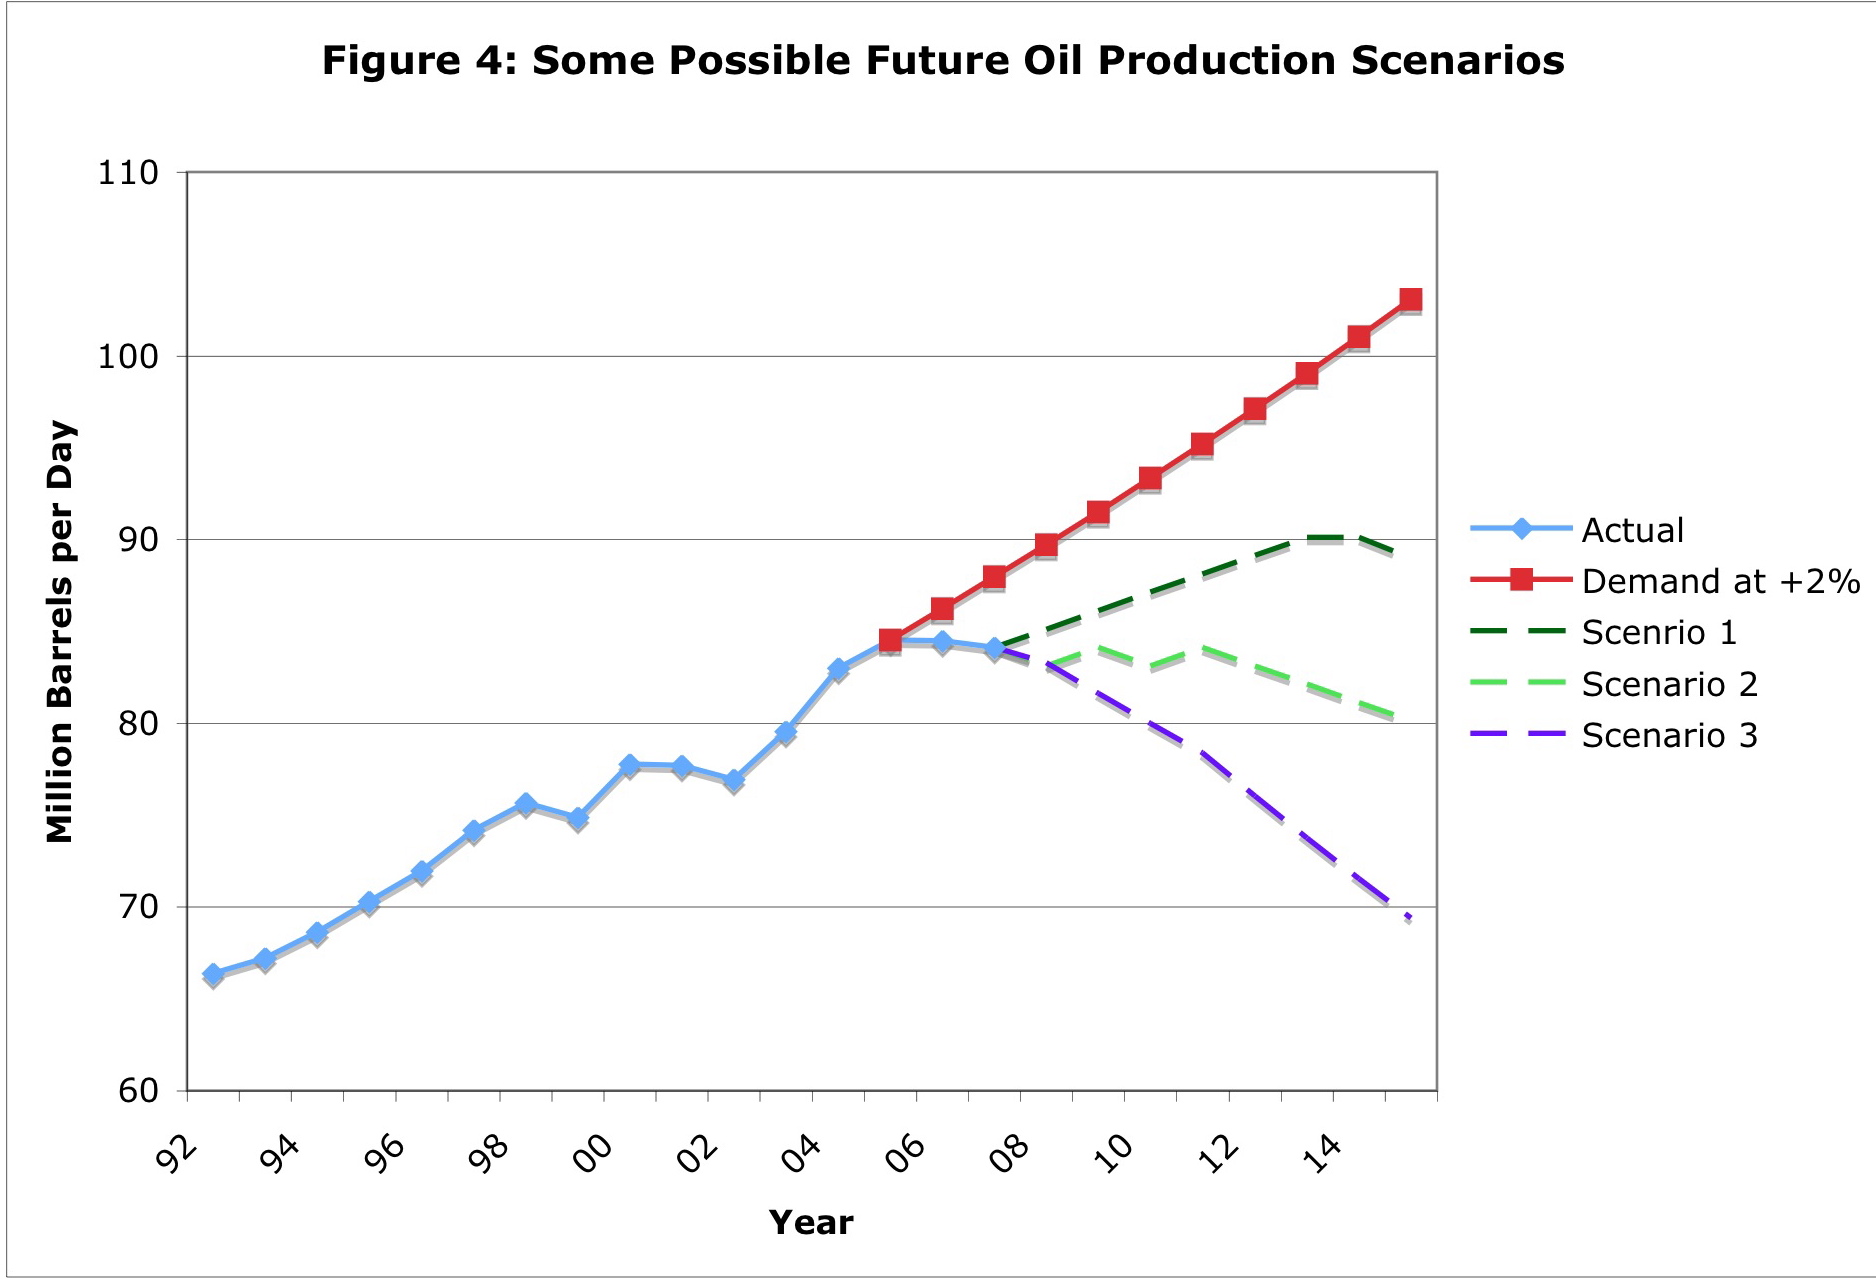
Finally we close with some wave forms of possible future scenarios:
- Under the 2% demand sceanario worldwide (this has been adjusted downwards from the
5% expectation based on the collapse of the chinese economy) demand rapidly exceeds the physical
supply capabilities in 5 years (obviously higher demand rates makes this situation worse).
- Scenario 1 is where someone actually builds new refineries (so we reach 90 mbd)
to accomodate this demand but that effort clearly falls short.
- Scenario 2 is where we do nothing and just let the older refineries eventually break.
- Scenario 3 is the case where the high price of crude oil in Summer of 2008 was sufficiently
scary that demand actually starts to fall at the rate of 2% per year.
We will see which Scenario actually plays out.