Washington State: A Case Study in Energy Generation
Washington State: A Case Study in Energy Generation
Examining the time evolution of power construction and energy demand in the state of Washington represents a good microcosm of the larger scale problem of planning for increased demand.
We will see that Washington starts out with large energy potential and small energy demand - a condition that favors the rapid growth of industry and exportation of energy to more populated areas.
Later, during the 1970's, population growth became large in Washington and the need for more in State power generation facilities escalated and some poor choices were made as a result.
The Era of Major dam Building (1950-1975)

But let's start near the beginning.
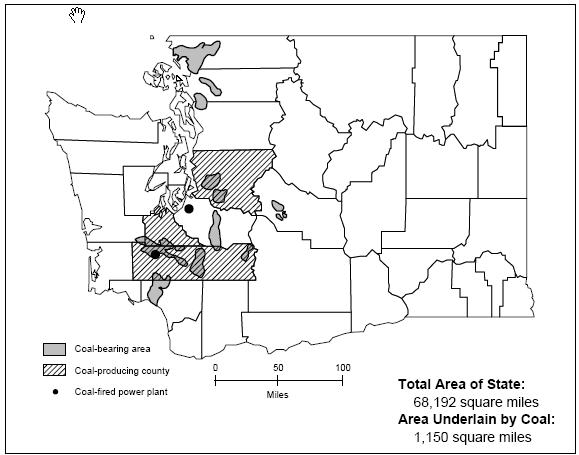
The history of Coal in Western Washington:


 Historically in the US, infrastructure tracks the
flow of energy.
Historically in the US, infrastructure tracks the
flow of energy.

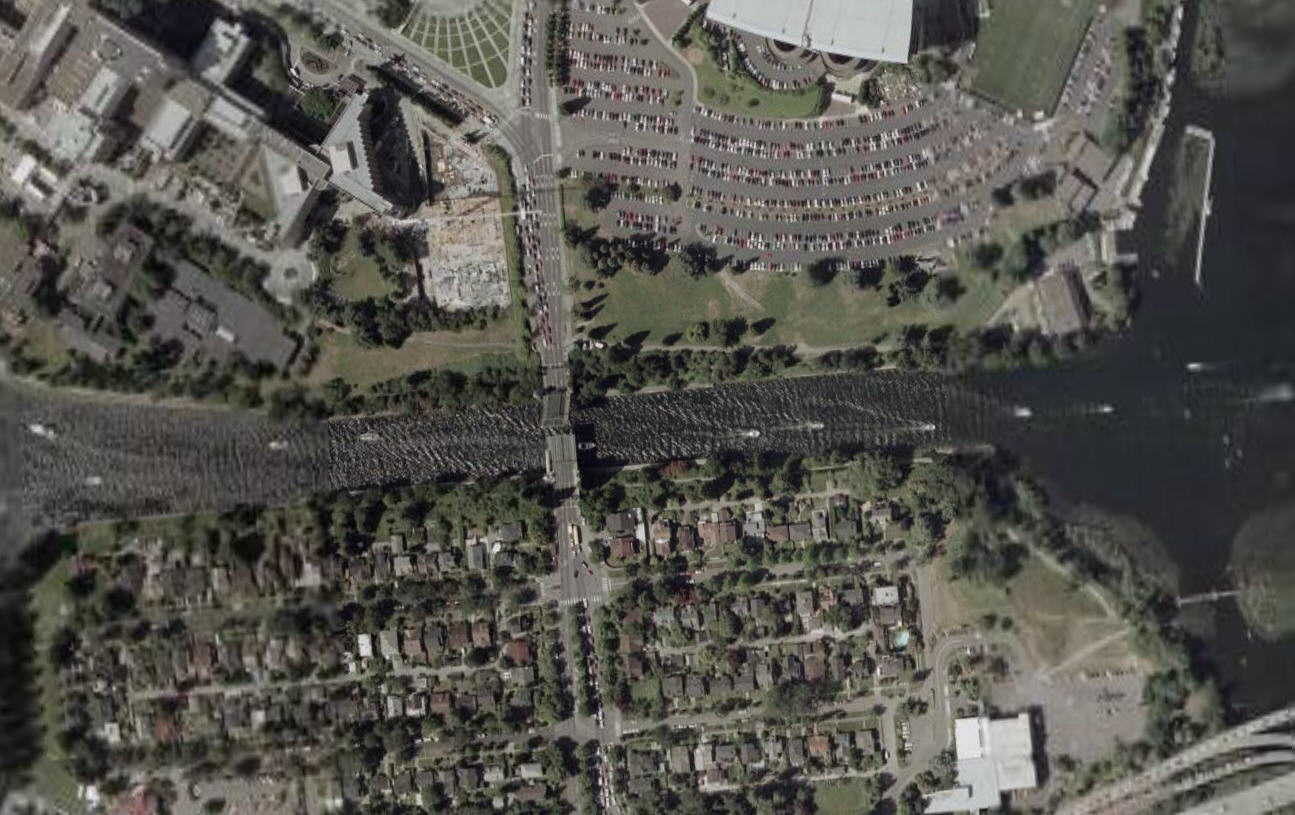
Of course, true to our nature, shortly after the Lake Washington Ship Canal was finished, the coal had been mined out on the east side.
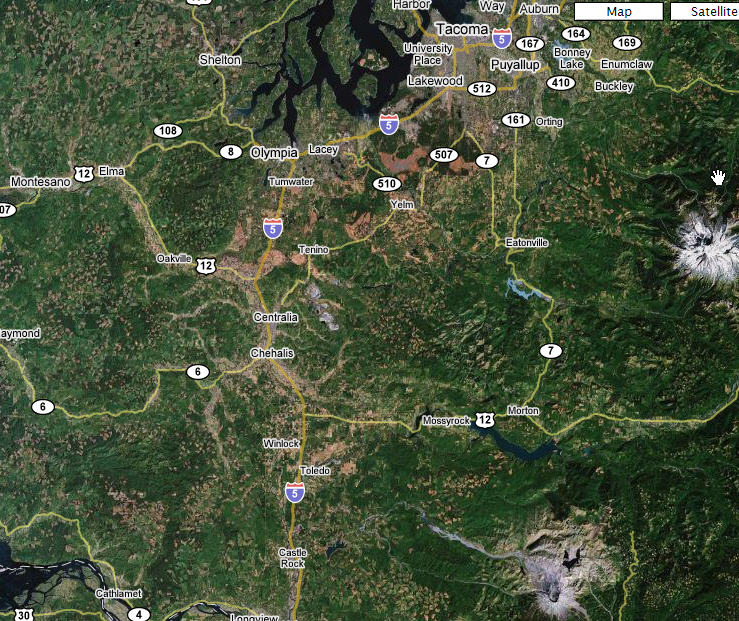
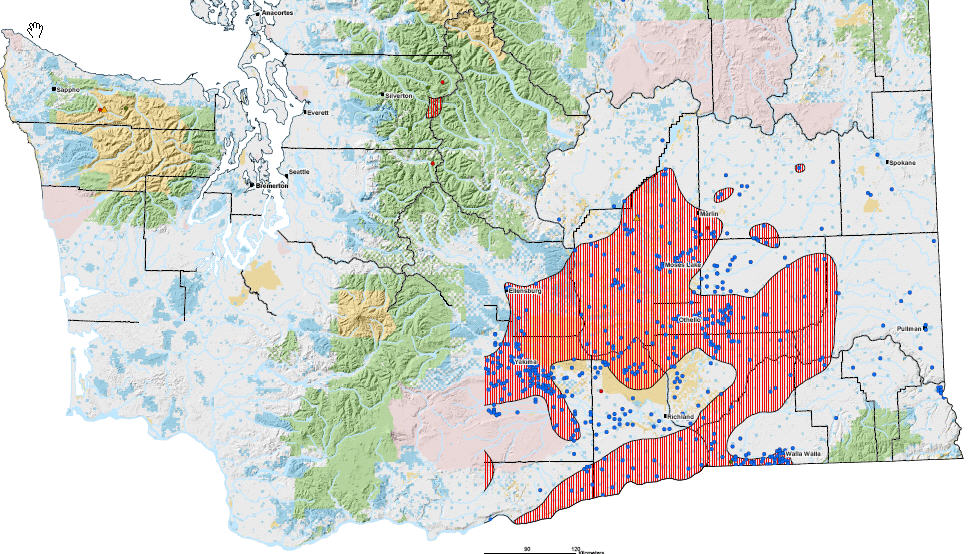
And the coal is mined via open pit strip mining on a pretty large scale. Note the large linear features which is where the tranmission lines are.

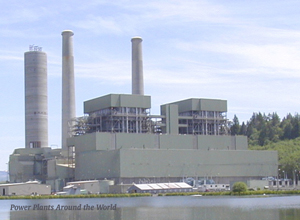
20 Years later the Centralia Coal Fired Steam plant opened (in 1971) with 1400 Megawatt capacity from 2 700,000 KW boilers.


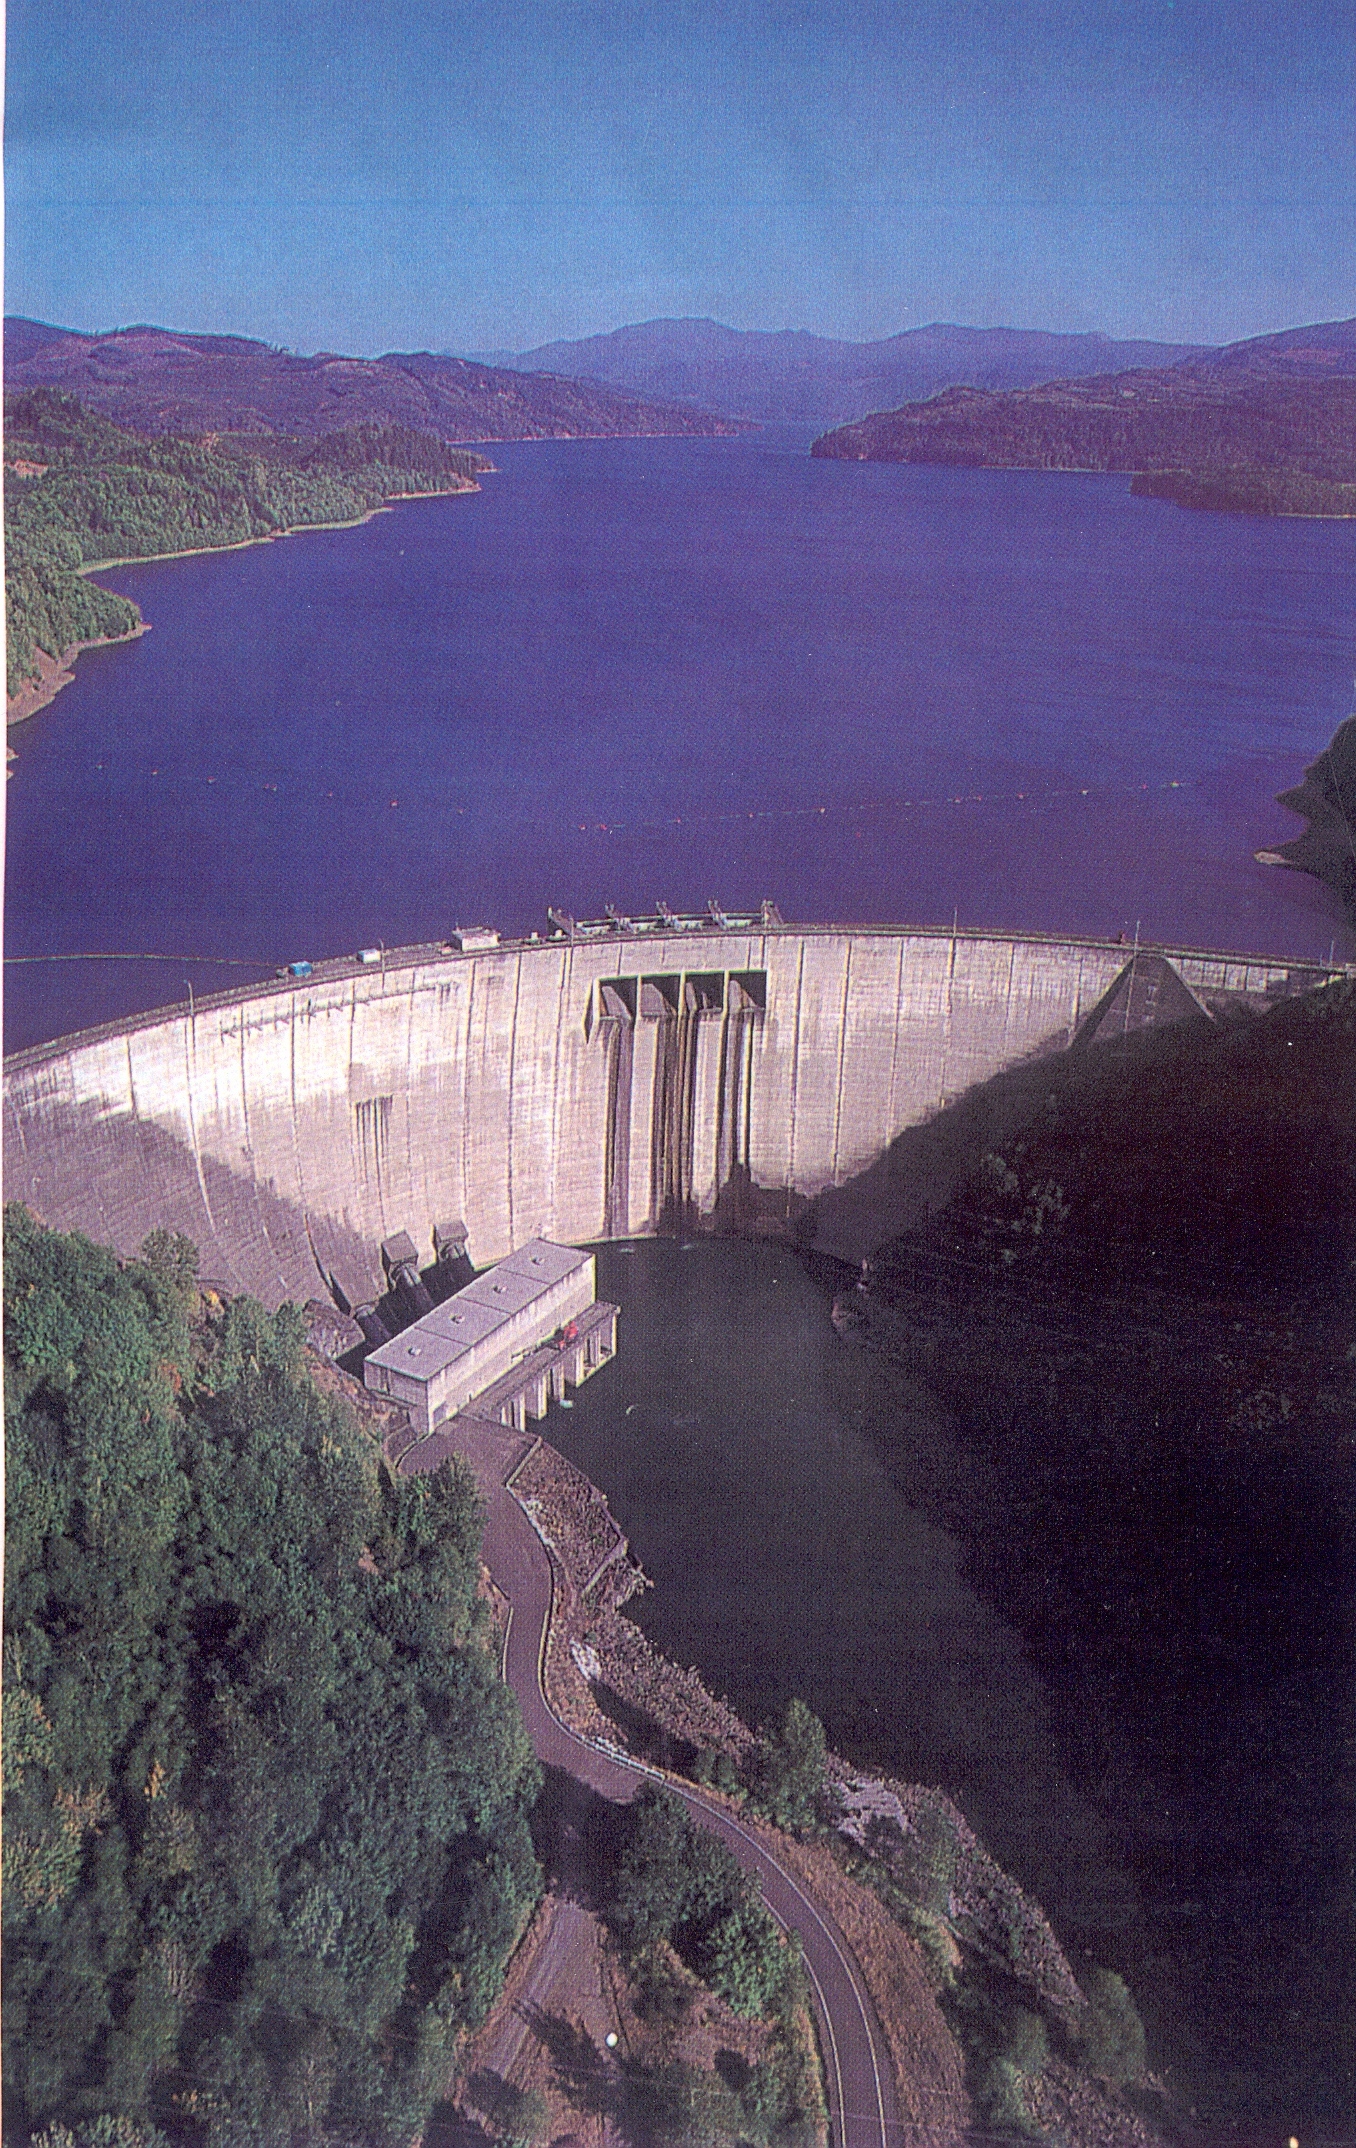
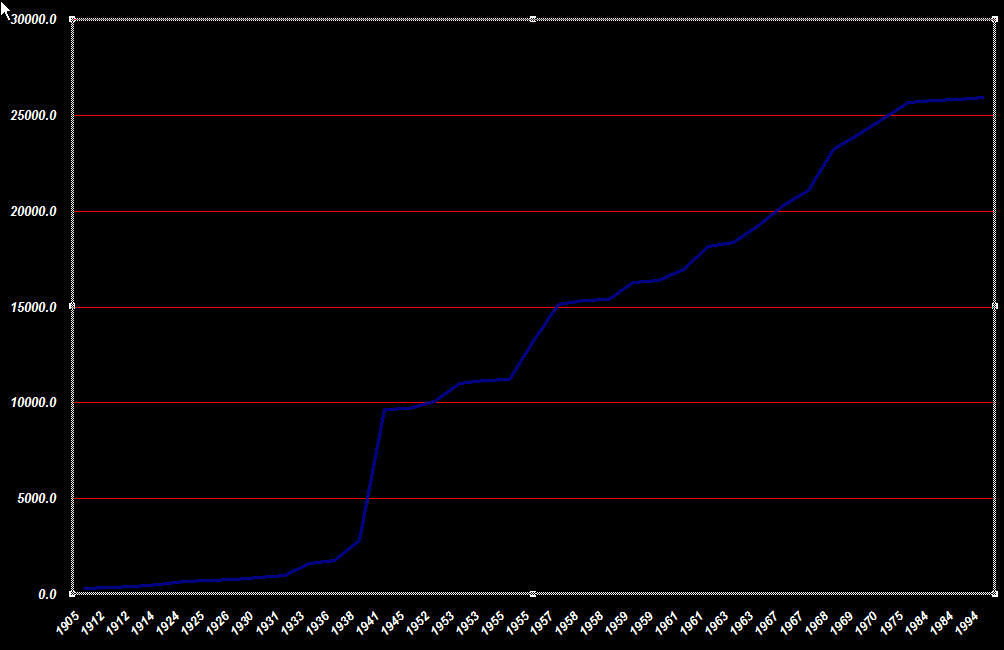
First dam (Mossyrock, still in operation) had a Nameplate capacity of 300 Megawatts and was built in 1905. (Note: Nameplate capacity is total potential capacity; actual operation usually produces about a factor of two less power due to strong seasonal fluctuations in water flow).
Given the population at the time, 300 MW is a large unit capacity - more on this later.
Hydroelectric growth is fairly slow (see graph below). Between 1905 and 1931, 8 new dams were built which raised the total nameplate capacity to 1000 Megawatts in 1931. Still, at that time, this was sufficient to support a regional population of 2 million.
We will soon enter the era where single dams are now at least 1000 MW.
In 1933 the Rock Island Dam (near Chelan) (625 MW) on the Columbia is completed:
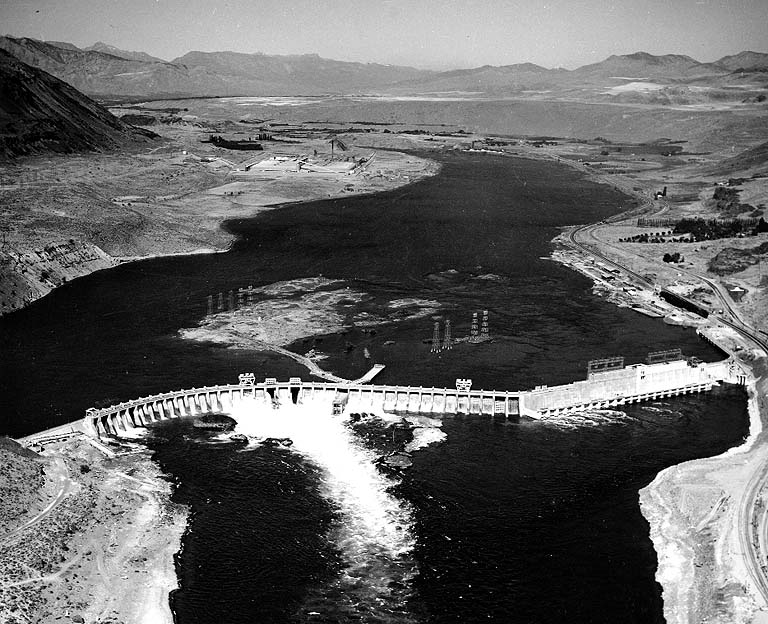
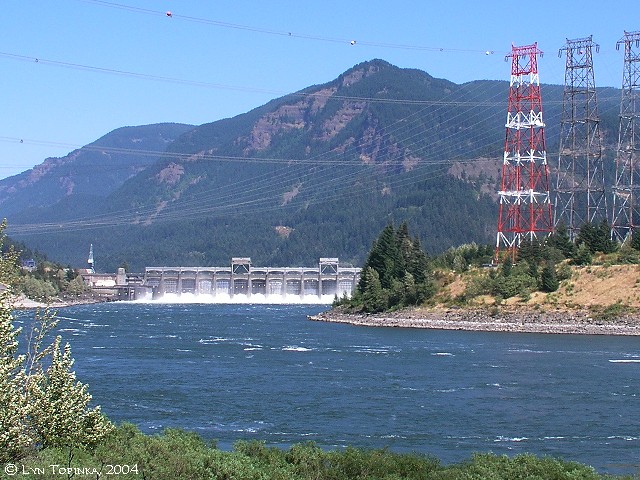
In 1938 The Bonneville Dam is completed (1100 MW); second power house added in 1982 to produce another 1100 MW. This dam would be come a high priority WW II Japanese air target in any mainland attack.
In 1941 the gigantic Grand Coulee Dam first came on line with a nameplate capacity of 6800 MW.
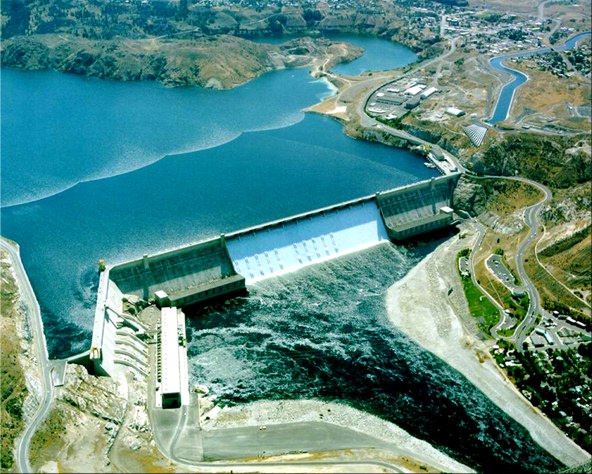
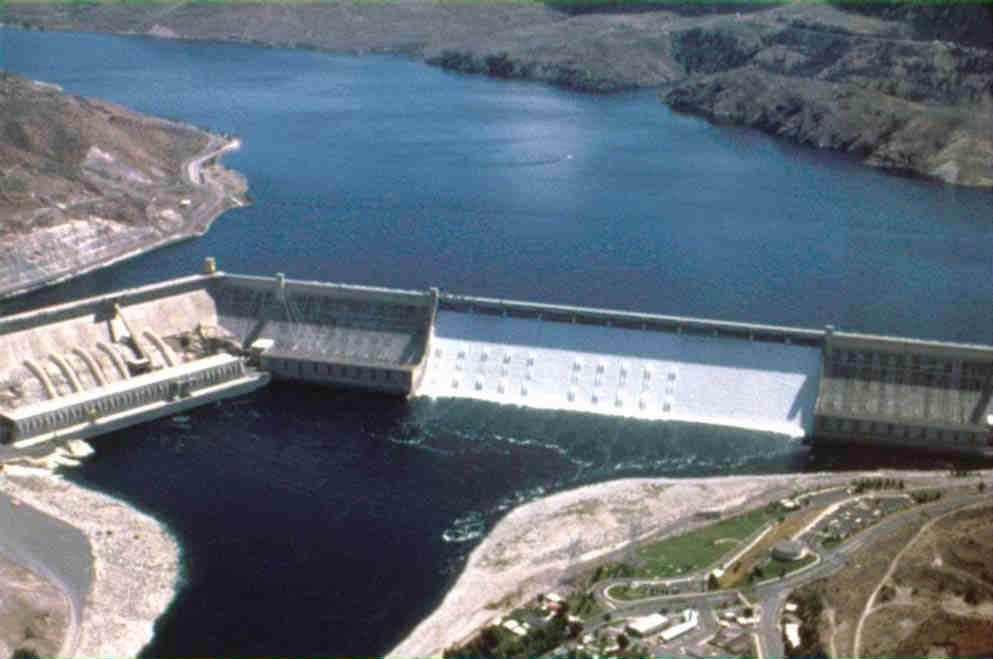
The Grand Coulee Dam is the largest concrete structure ever built. This barricade, which raises the water surface 350 feet above the old riverbed, is 5,233 feet long, 550 feet high, and contains 11,975,500 cubic yards of concrete.
This structure was essential the infrastructure of the American West and the Bureau of Land Reclamation. This is a large story that will be discussed later.
When Grand Coulee is finished, the total hydropower nameplace capacity in Washingtion is now 10000 MegaWatts.
By 1959, 4 other large Dams are constructed on the Columbia river raising the total nameplate capacity to 16000 Megawatts.
By 1968, 4 more Dams had been added (none have been added since) and total nameplate capacity is now 23000 Megawatts.
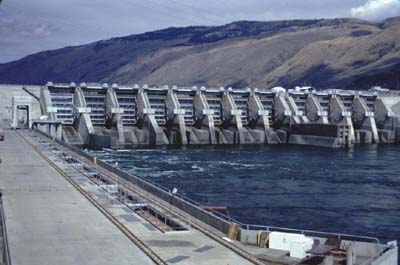
From 1968 to 1975, 3 large Dams are constructed on the Snake River bringing the total hydro nameplate capacity to 25600 Megawatts, essentially what it is today.
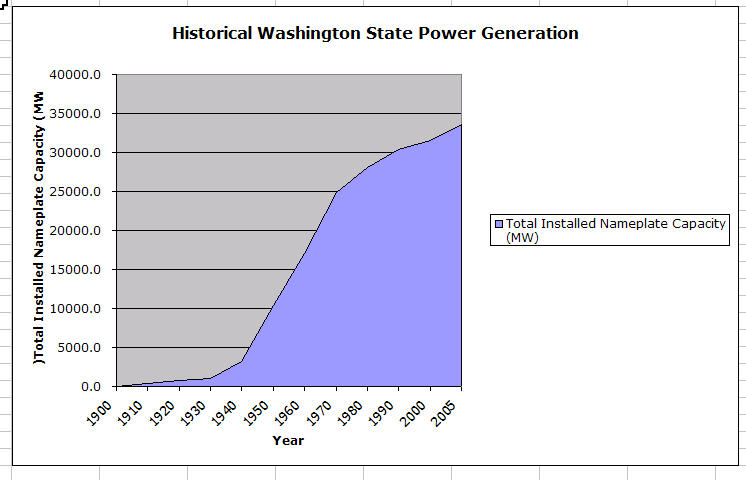
In Graphical Form, this history looks like the following:
That basic waveform is duplicated when one consider all sources of power generation in washington state.
But the important metric is Persons per installed MW. That behavior is shown below:
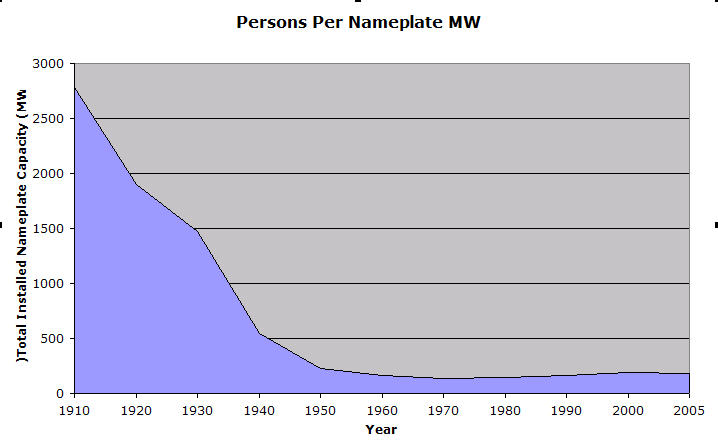
Things were best in 1970 at 137 Persons per MW but by 2005 this has
risen to 185 or an increase of 35% This is
significant.
But, since energy consumption per capita is mostly constant, this means, with increasing population, increasing production is needed.
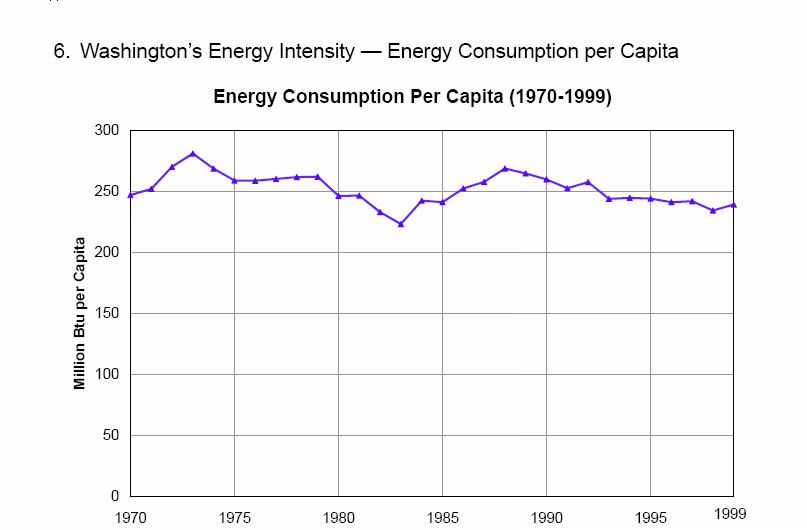
However, since 2000, per capita consumption of electricity is starting to increase due to the proliferation in households of: a) multiple computers, b) LAN gear, c) cell phones/charges, d) gaming consoles, e) HDTVs, f) cable boxes
With the end of the hydro era (due to environmental concerns, federal licensing problems, and high initial capital costs) Washington state turn to possible Nuclear power in the 1970s (as was much of the rest of the country).
In the mid 1970's the Washingtion Public Power Supply System (WPPSS - or WHOOPS) proposed to build 5 nuclear power platns (each at about 1200 MWs).
Three of them were to be built on the Hanford Reservation and 2 of them were to be built at Satsop, in Western Washington. (Satsop is in the middle of nowehere, about 30 miles east of Aberdeen Washington).
To make a long story short:
Currently, Washington state, with its reduced snowpack, is in danger of having insufficient power production year round.
Hence Moving to Wind may be sensible.
And Washington has reasonable geothermal potential: