2009	665
2008	613
2007	243
2006	177
2005	97
2003	66
2002	4.6
2001	1
In order to find the growth rate you need to figure out, using reflective thinking, ie. what is the data telling you, which part of the data might be taken as the most representative part in determining the annual growth rate.
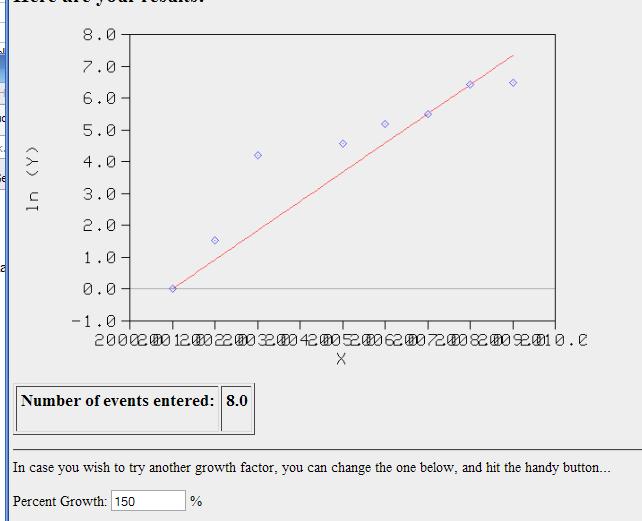
So, if you treat this as a black box and take all of the data, then the resulting growth rate is completely dominated by the first two data points with low numbers.
You end up with this:
And a growth rate of 150% or a doubling time of 70/150 or about 6 months>. Does that seem right to you? From 2006 to 2007 the data went from 177 to 243 - it did not experience 2 doubling times in that period else the 177 would ahve went from 177 to 4x177 or 708 in the year 2007!
In addition, some of you, for unknown reasons, took the growth rate to mean the growth rate over that period of years. No, that doesn't make sense - the individual annual data points define the annual growth rate. Indeed, there is a reality check here. Suppose that 150% was the growth rate over the 9 year period. Well, in year 1 there was 1 unit therefore in year 9 there should be 150 units, not 665! Reality checks are always there but you never utilize them if your don't ask the question:
Does this result make any sense?
For this case you want to derive the growth rate with the first 2 years removed. That yields.
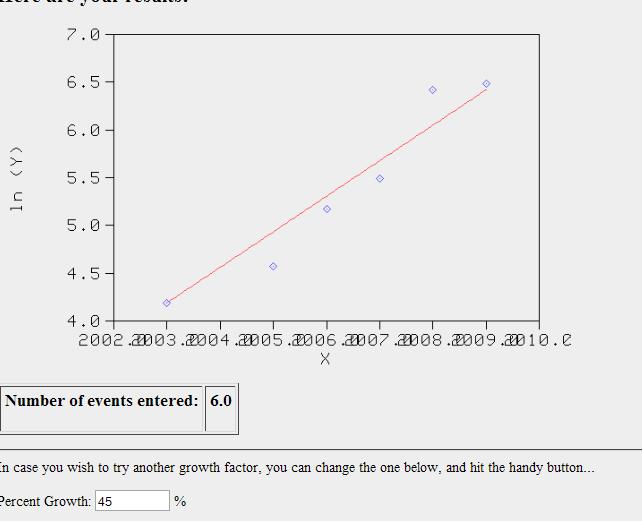
Which is much more reasonable.
In general, most of you never looked
at the data to think about. Indeed, the point of the exercise
was to get you to realize that is possible to derive absurd
results if you dont' intelligently filter the data. An absurd
result ripples through but many of you never performed a reality
check.
You may think that data is irrelevant and boring and someone else
will do the work for you. In that case, the world is what you
made it with that attitude.