Answered well
Need to discuss and define
- Power plants runs best at constant/average output
- Most Utility companies don't own "peaker" plants or have energy storag
- have to buy power on the spot market which is very expensive
- Have ON peak/OFF peak pricing; encourage electricity conservation
This question was answered well for those who did well on the exam and not correctly at all by others. This was explicitly discussed in class on Monday before the exam and is in the course notes.
Counting errors go as the square root of the count. 100 people were asked.
Random error is +/- 10 points. 55 is not scientifically significantly more
than 45 due to the large random error. Would need to ask at least 1000 people
for 55 vs 45 difference.
Answered fairly well but many of you confused production with processing. We can
produce more oil than 85 MBD but there is no way to process that into refined crude oil
because the refiniery infrastructure is saturated. That produces the plateau.
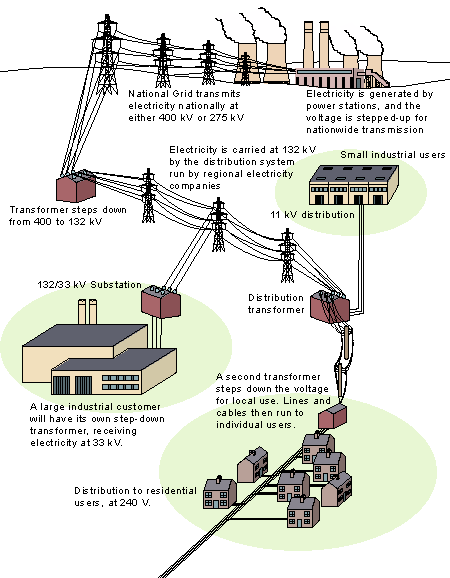
Power = V x I; I = Power/Voltage = 1000/250 = 4 amps (tho most people didn't include the amps)


Most people left out the important neighbhood transformation between you local substation and you house.
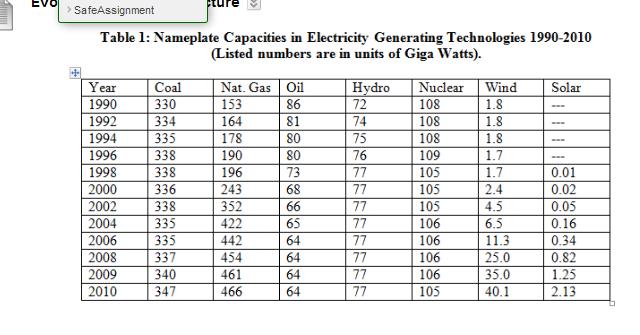
This question is entirely related to this chart shown and discussed in Week 1. The absolute key
point is the tremendous rise of Natural Gas during this time period as a source of electricity.
Very few people said this. This is discouraging. If you only learn/retain one thing about this
class, it should be that the US plan is an increasing dependence on Natural Gas (NG) as an
electricity source.

This question is traditionally not answered well
Answered: mostly generically and not specifically.
which many of you memorized but didn't understand its meaning.
Mathematically, because 1/k is outside the Ln term, it dominates as the
exhaustion timescale depends directly on 1/k but only depends on R logarthmically.
Hence k, the consumption rate, dominates the calculation of Te as changes in
R only show through as LN (R).
Hardly anyone said all of the above.
The best qualitative version of the above is something like this
Resource production is described by a Bell curve - this means you can calculate the
depletion using the initial consumption and the growth rate.
The doubling time of consumption occurs independently of R so k must
dominate the exhaustion timescale so even if R is really 2R the resource
is just exhausted in the next doubling time.
Need to know three parameters:
Those integrate together into an equation for an exponential exhaustion time:
Wind: 50 GW in 2012
Yes there is an exact answer to this question using math I don't expect you to know.
I do expect you to simply apply the doubling time and make an estimate:
Wind build out doubling time = 70/15 = 4.5 years
US: 1.5 TW in 2012 --> 3 TW in 2012+35 = 2047
US electrical growth at 2% has 70/2 = 35 years doubling
100 GW in 2016.5
200 GW in 2021
400 GW in 2025.5
800 GW in 2030
1.6 TW in 2034.5
Okay your there and its not even 2047 so sometime between 2030 and 2035 wind
would be at about 50% of US. A more exact answer is sometime around 2025 but
who cares --> the point is that wind is on a trajectory to reach this goal
relatively fast.
Answered Variably.

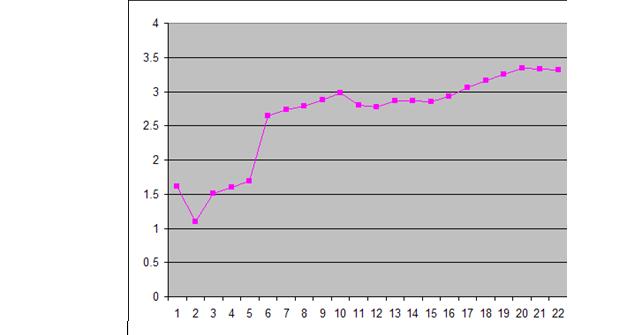
While most of you said that the first 5 years worth of data should not be used - and they
certainly shouldn't be - hardly anyone looked at the data closely to notice that the last
3 years flatten completely. That's a big problem in determining a "growth" rate if your own
data has shown that you have, in fact, stopped growing.
Certainly more cons than pros:
Pros:
Cons:
Most people got lots of points for whatever they wrote but you got more points if you included some of the following points:
- Both crises are strongly energy related - running out of fossil energy now; back then wanted a substitute for dirty coal
- Similar idealogical goals between "sustainabily and green" and Mumford's
Neotechnic Era
 Purification
- we need large scale renewable energy projects; back then it was hydro
- we need improved infrastructure
- we need government initiated large scale wind and solar now that will create jobs/opportunity in a similar way that the hydro and other public works projects (e.g. roads, bridges, etc) did in the 1930s.
- But the scale is much different now: back then, when completed, hydro projects produced 45% of the nation's electricity and this was done in 10 years!
- Infrastructure takes a long time to build these days for lots of reason and wages are much higher now than then. Therefore, the equivalent of putting 150,000 people to work on various infrastructure projects in today's terms is more than we can afford with some initial stimulus package.
- Congress has no committment to long term projects
- An Obama Unit has already been spent and little of it went is this direction