 since the last ice age, 2/3 of the
West Anarctic Ice Sheet has been lost and this has raised sea level by
10 meters.
What might some of these outputs be?
20,000 years
of change  since the last ice age, 2/3 of the
West Anarctic Ice Sheet has been lost and this has raised sea level by
10 meters.
1900 Image
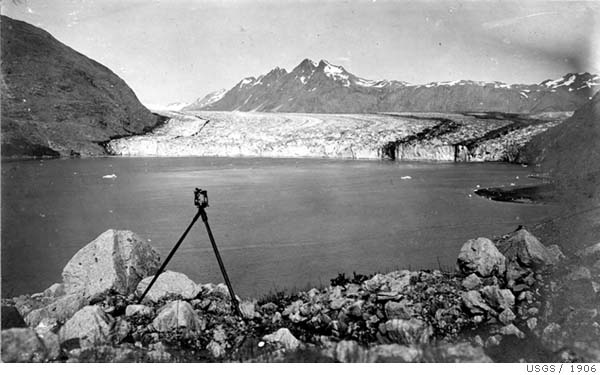
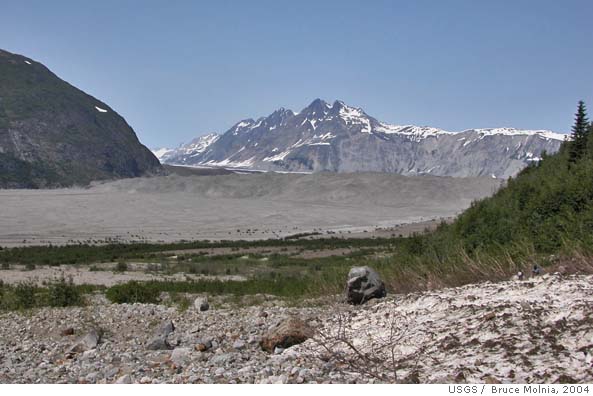
2004 Image
The earth has a natural greenhouse effect due to trace amounts of
H20 and CO2 that naturally occur. The
enhanced greenhouse effect refers to the
augmentation of these
natural gases by human activities.
What's the evidence?

The energy balance in the atmosphere is shown here:
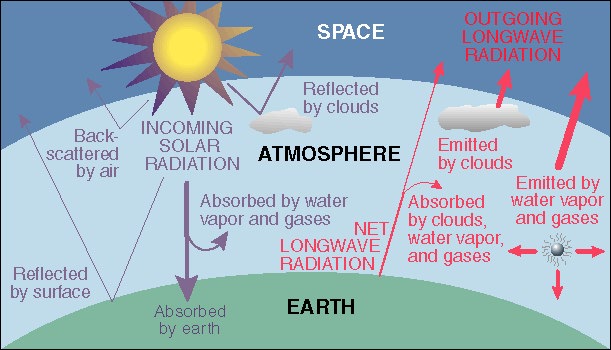
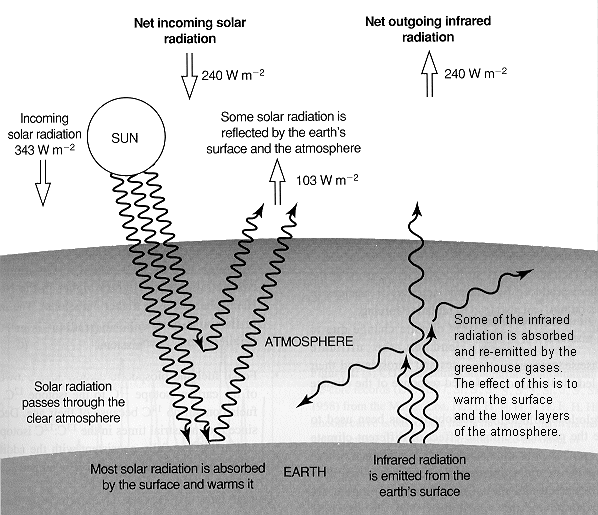
Table 1
Characteristics of some major (climate changing) greenhouse gases
|
Greenhouse gas |
Sources |
Sinks |
Importance for climate |
|---|---|---|---|
|
Carbon Dioxide (CO2) |
1) Burning of fossil fuel 2) Land-use change (deforestation) |
1) Ocean Uptake 2) Plants!& photosynthesis |
Absorbs infrared radiation; affects stratospheric O3 |
|
Methane (CH4) |
1) Biomass burning 2) Enteric fermentation 3)Rice paddies |
1) Reactions with OH 2) Microorganisms uptake by soils |
Absorbs infrared radiation; affects tropospheric O3 and OH; affects stratospheric O3 and H2O; produces CO2 |
|
Nitrous Oxide (N2O) |
1) Biomass burning 2) Fossil-fuel combustion 3) Fertilizers |
1) Removal by soils 2) Stratospheric photolysis and reaction with O |
Absorbs infrared radiation; affects stratospheric O3 |
|
Ozone (O3) |
Photochemical reactions involving O2 |
Catalytic chemical reactions involving NOx, ClOx and HOx species. |
Absorbs ultraviolet and infrared radiation |
|
Carbon Monoxide (CO) |
1) Plant emissions 2) Man-made release (transport, industrial) |
1) Soil uptake 2) Reactions with OH |
Affects stratospheric O3 and OH cycles; produces CO2 |
|
Chlorofluorocarbons (CFCs) |
Industrial production |
Insignificant in troposphere, dissociated in stratosphere (photolysis and reaction with O) |
Absorbs infrared radiation; affects stratospheric O3 |
|
Sulphur Dioxide (SO2) |
1) Volcanoes 2) Coal and Biomass burning |
1) Dry and wet deposition 2) Reactions with OH |
Forms aerosols, which scatter solar radiation |
 375 ppm
(29%)
 360 ppb
(11%)
 (143%)
Data showing the increasing concentration of Greenhouse Gases:
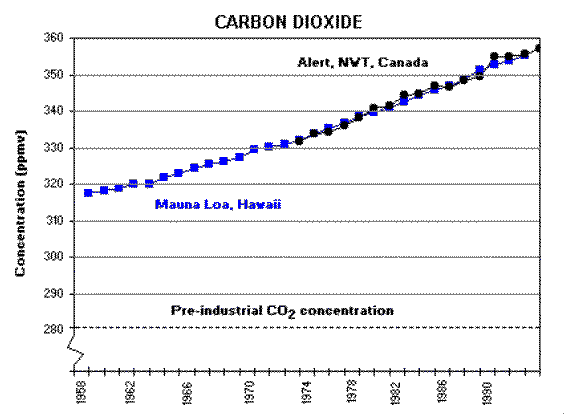
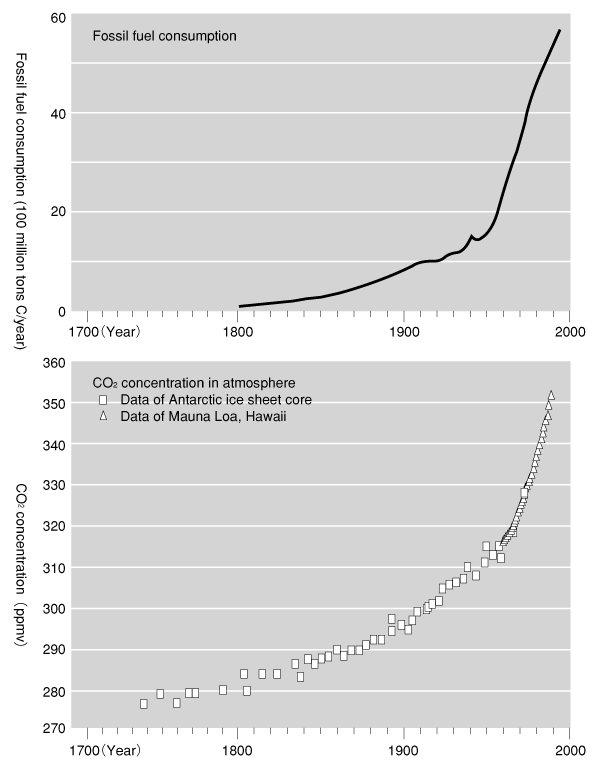
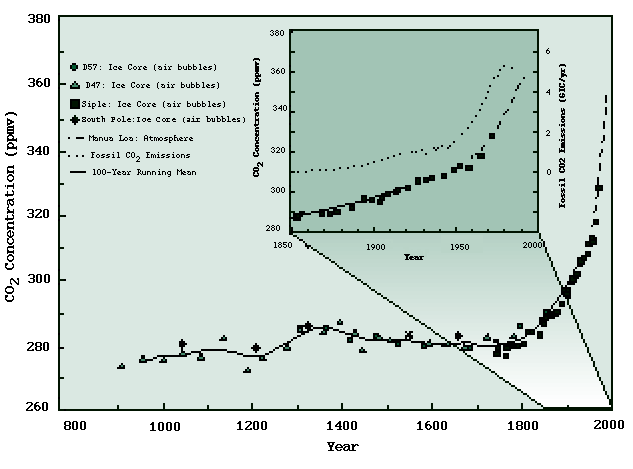
NOx is leveling off due to pollution abatement on vehicles but this is offset by increasing vehicular traffic
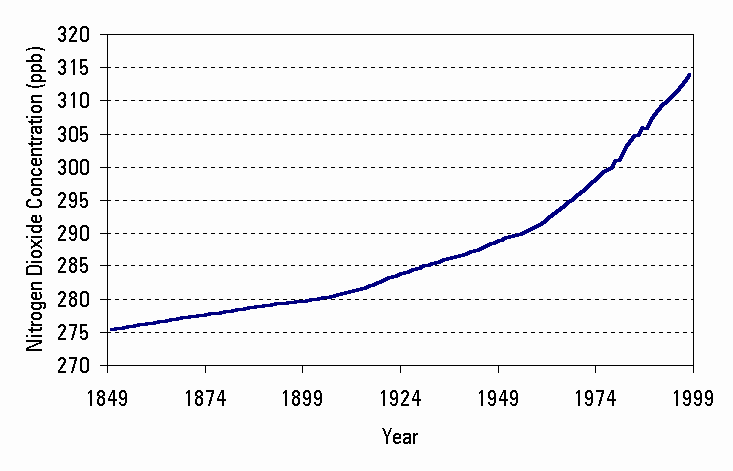
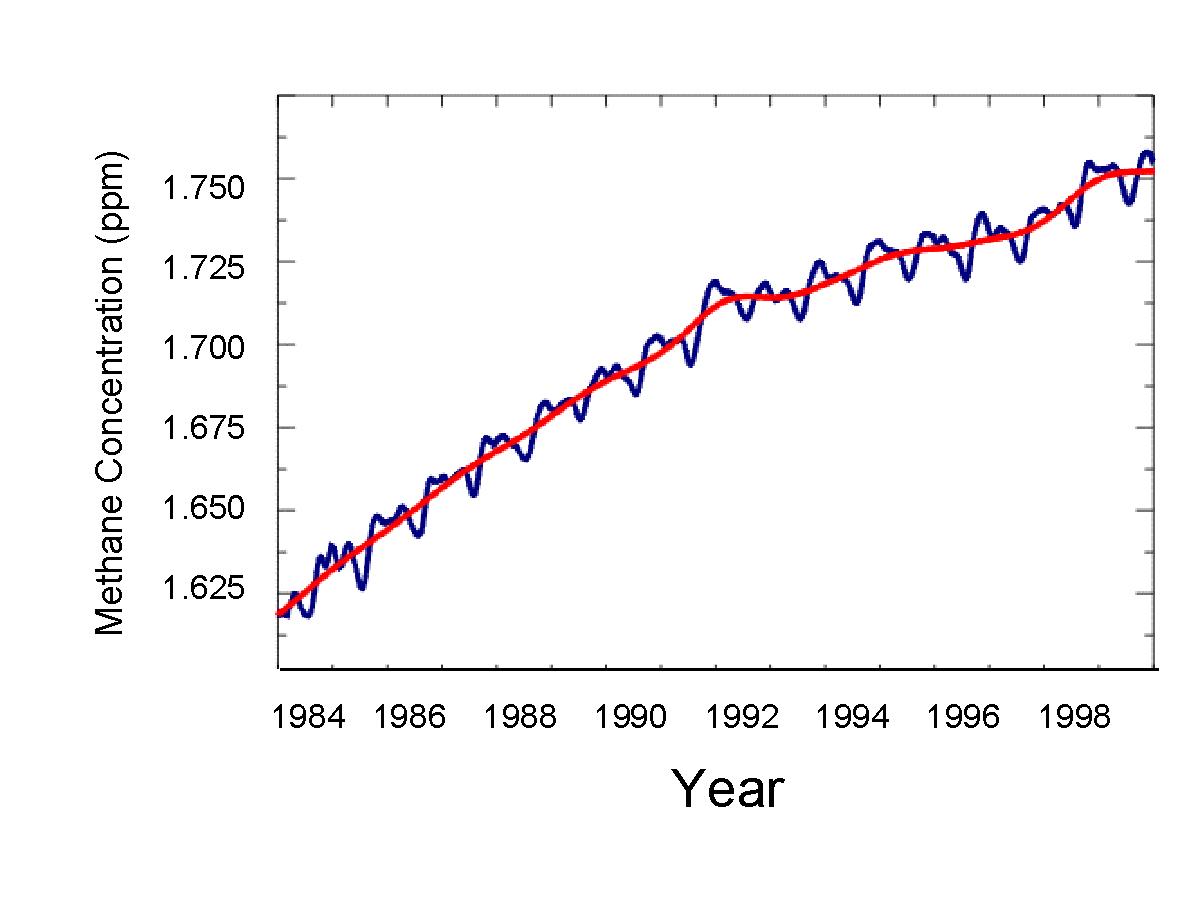
CH4 is only recently been measured. Rate of increase
is about 10 ppb per year. However, since 1 CH4 molecule
is worth 25 CO2 molecules, the equivalent growth rate
in terms of CO2 is 2.5 ppm. Thus methane may eventually
be the dominant enhanced greenhouse gas in our atmosphere. What
can we do about this?
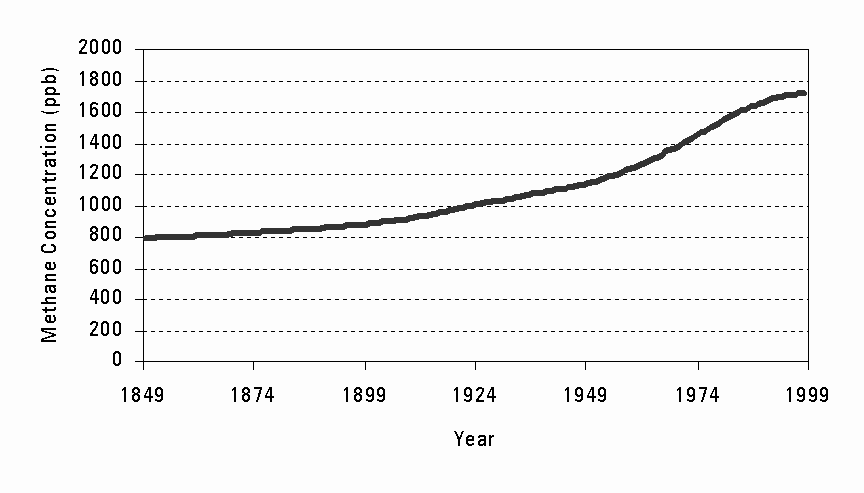
Recent Measurements (on going monitoring)
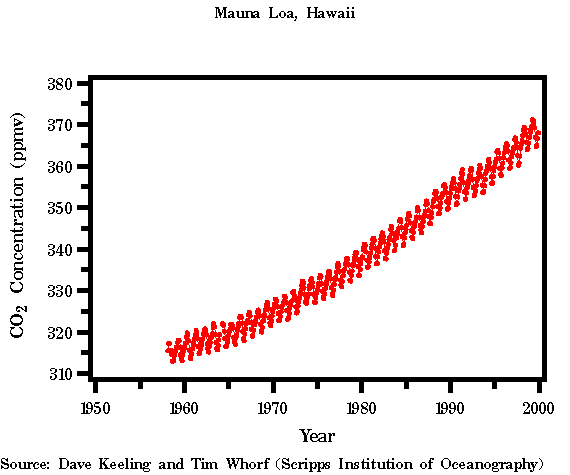
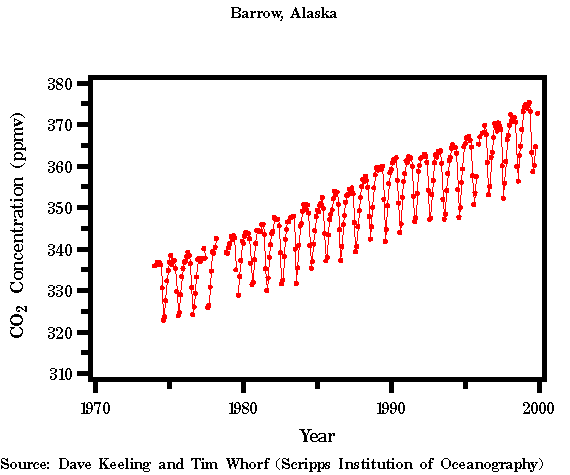
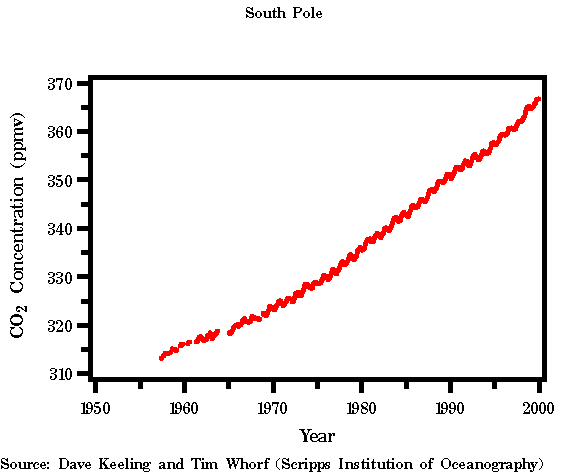
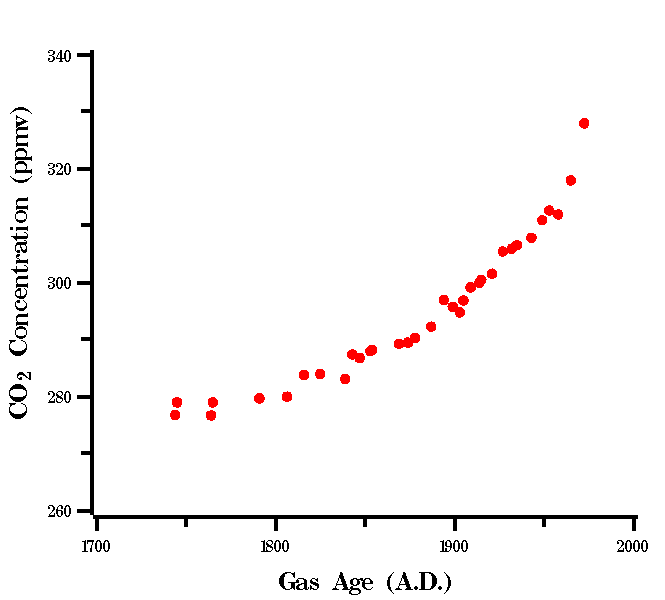
Recent Ice Core Data

Land Use Changes:
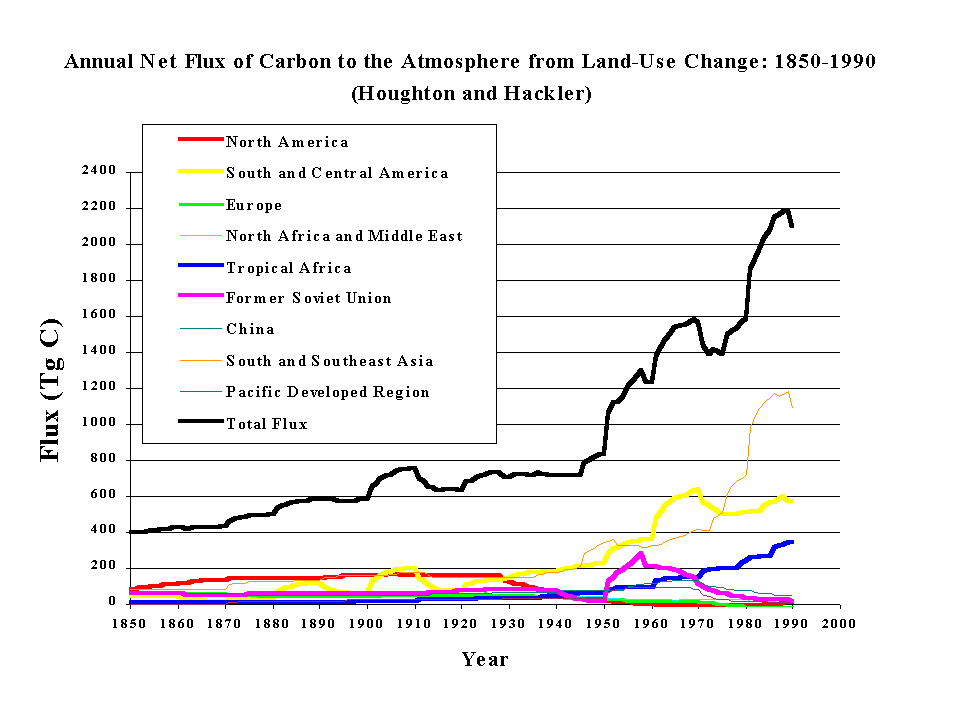
Okay, so now we have a pretty strong indication that atmospheric CO2 is building up over time. Are there indications that this is leading to a warmer planet? (This is the nature of your first assignement)
Again, here is some data:
 very difficult
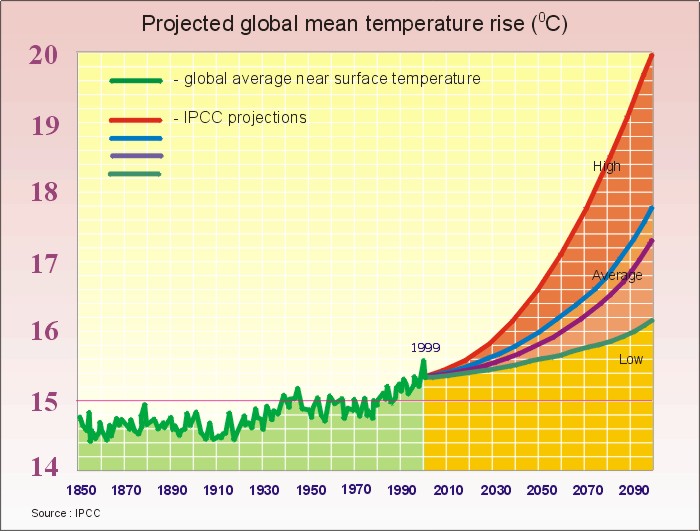
But the past is an interesting guide:
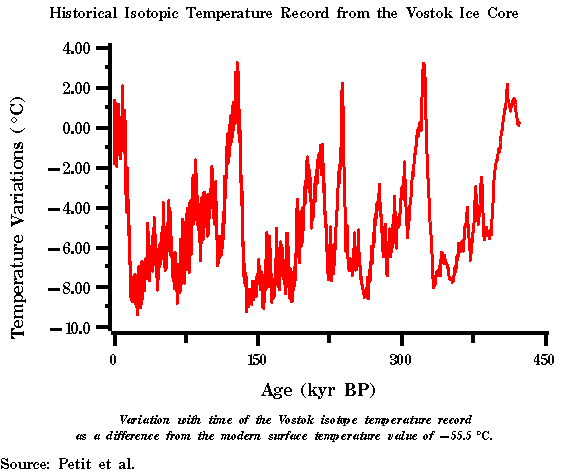
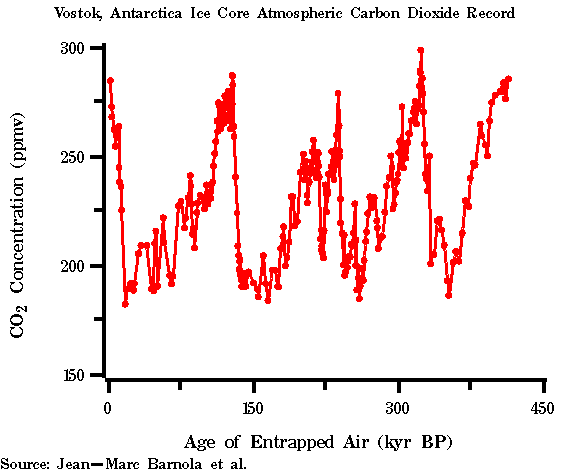
The data which convinced the scientific community (1999):


This was followed by mid-century cooling, again thought to be natural:

Which was then following by likely human induced warming:

Since 2000, clearly there is systematic world wide warming:
The Best Visualization to Date
Animated Sequence for Summer Months