(blue line = smoothed trend)
The most common technique available is "smoothing". These techniques serve to surpress the noise and to extract real trends and patterns.
Note that smoothing and averaging are not the same:
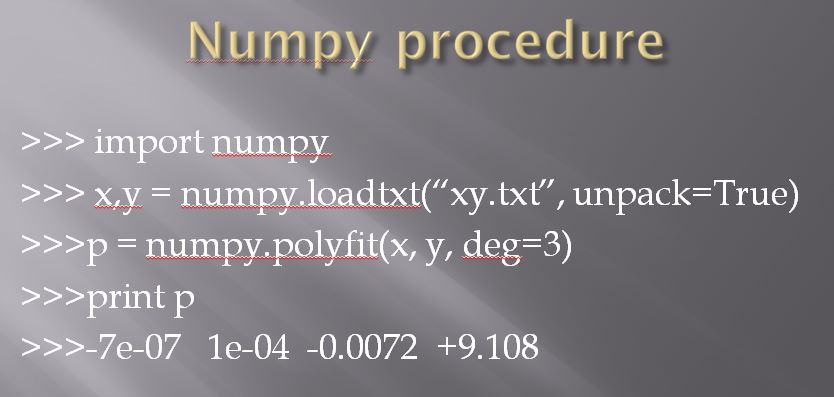
Techniques:
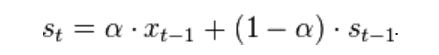
The functional form of this smoothing is governed by one parameter, the smoothing parameter, and it has a value between 0 and 1. Values close to one have less of a smoothing effect and give greater weight to recent changes in the data, while closer to zero have a greater smoothing effect and are less responsive to recent changes. There is no formally correct procedure for choosing the smoothing factor -its a scientific judgement call.
Example excel spreadsheet (cell K1 is the only thing to change and is the smoothing parameter)
 The 'kernel' for smoothing, defines the shape of the function that is used to take the average of the neighbouring points. A Gaussian kernel is a kernel with the shape of a Gaussian (normal distribution) curve. Here is a standard Gaussian, with a mean of 0 and σ (=population standard deviation) of 1.
 For an example, let's say we want to replace the 14th value in our data
set with a smoothed value.
For an example, let's say we want to replace the 14th value in our data
set with a smoothed value.
We have chosen our kernel to have standard deviation of 2.5 units on
the X-axis. With the kernel centered x=14 and scaled so that the total
area of the Kernal = 1 (this is required) our smoothing function now looks
like this.
 The discrete version of the function is shown at the left. The table below summarizes the x,y values of the function as well as the actual data.
| X | Y | Y-data | 12 | 0.117 | 1.065 | 13 | 0.198 | 0.389 | 14 | 0.235 | 0.349 | 15 | 0.198 | -0.656 | 16 | 0.117 | -0.195 |
Note: we used a gaussian kernel with σ = 2.5. The example used here just uses the first 5 points (eg. ~ +/- 1 σ) which represents 86.5 % of the total area and so contains most
of the weight in the smoothing (but you really do want to use all of
the kernel to get the best results)
We want to produce a new value for x = 14 based on this weighted smoothing function.
That means we convolve our function with the data. That sounds
onerous, but its really quite simple and works like this.
The new Y-data point at X=14 is then:
0.117*1.065 + 0.198*0.389 + 0.235*0.349 + 0.198*-0.656 + 0.117*-.195
= .125 + .077 + .082 - .130 - .023 = .141 (compared to the actual data value of .349).
We then apply the same procedure to point 15 etc and end up with a convolved time series distribution that looks like this, where larger scale patterns are now more evident
This particular method is very good for image or pattern recognition and can be important for analyzing climate data:
The "lab" exercise for this will involve analysis of the rate of Arctic Sea Ice Loss . This is a very big deal as it changes the planetary albedo should it occur.
One of the things you will be asked to do in the lab exercise is
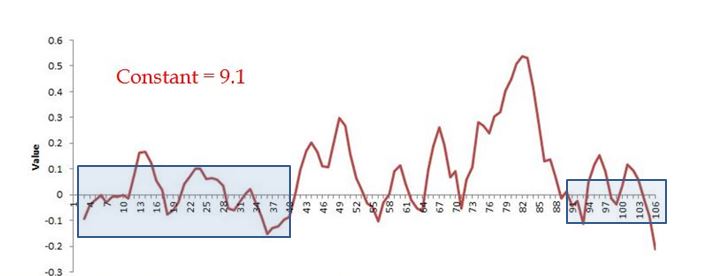
feature extraction:
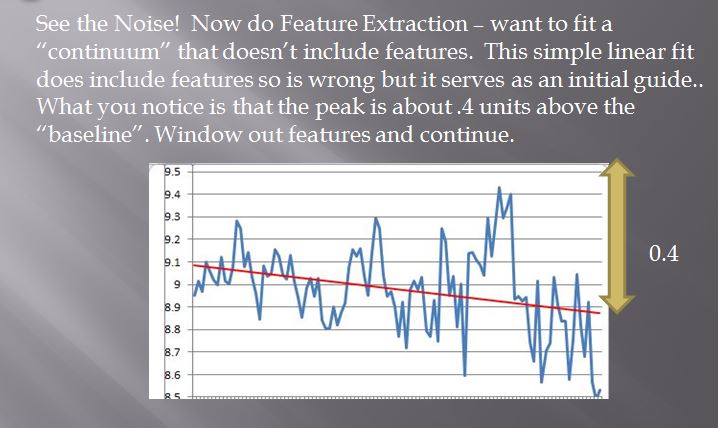
Feature Extraction in noisy data. This is highly useful and involves baseline subtraction to produce what is known as a "flattened spectra". While these is an easy procedure for features of high singal to noise, in the world of climate data there may be decadel features that are importnat but have overall low S/N and therefore are not properly recognized.
Visual Example:
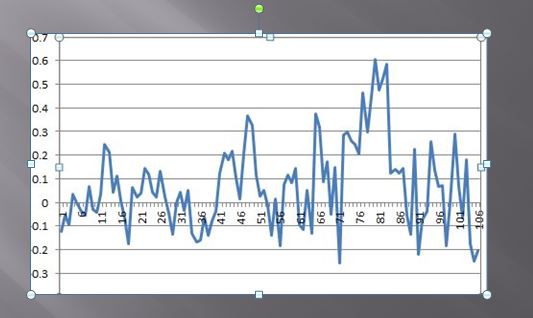
The most important part of dealing with noisy data is to produce a visualization (a graph) in which you can see the noise: