 What Went Wrong?
Projections made in the 1930's with respect to year 1975 US population were consistently wrong. These estimates ranged from 145-171 million.
Actual population was 215 million What Went Wrong?
Things have improved a bit then, but the example below shows the situation in 1975 with respect to the year 2000 population:
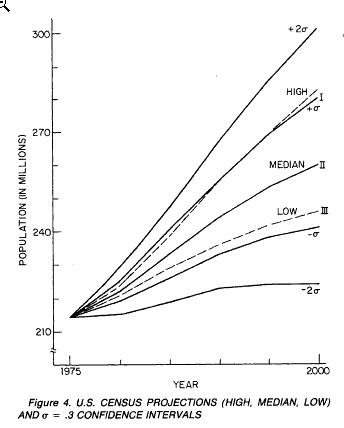
Actual US population in 2000 was 275 million which is barely in the cone of uncertainity.
The primary reasons that historical population projections for the US have been biased low are:
As shown below, the correction for immigration is huge!
Well, at least you don't have to worry about immigration ...
but,
What do you assume the behavior is for the annual exponential growth rate?
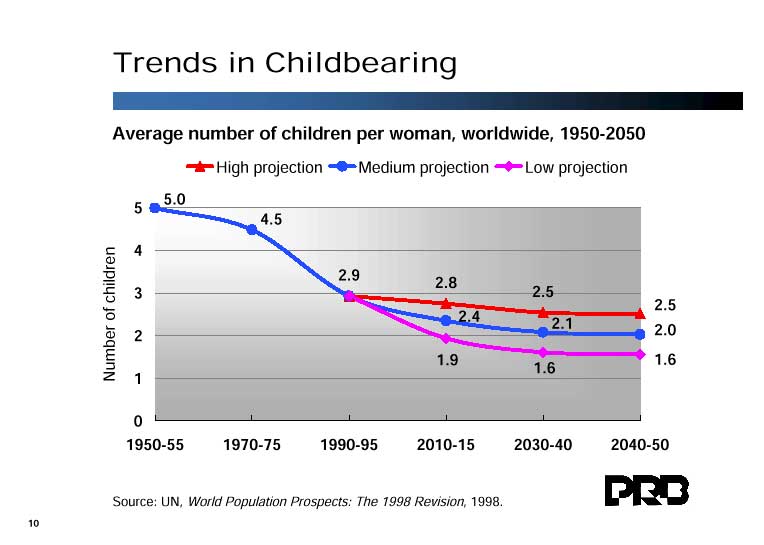
There are 3 generic classes of models depending on fertility rate. (we will do a spreadsheet exercise using 4 kinds of models, however)
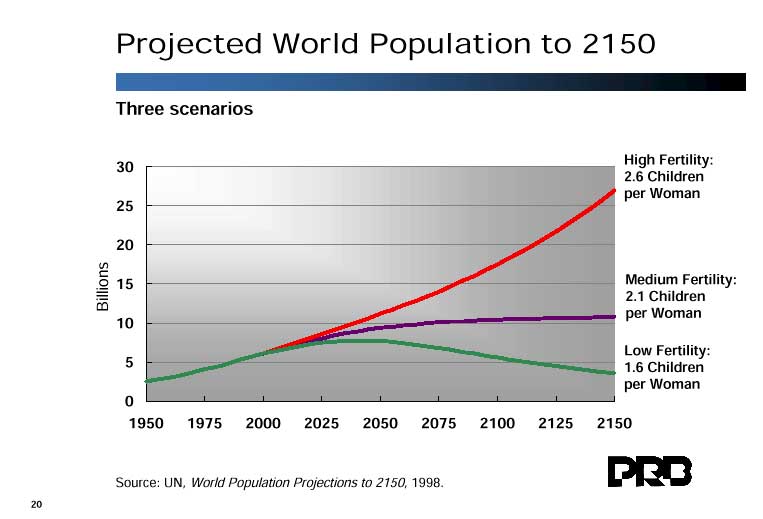
Clearly the fertility rate is the main driver here and that, of course, has a huge cultural dependence.
Its really an open question whether or not a cultural (or global) fertility rate can really get below 2.0.
Latest projections in round numbers
