Why do we care about statistical distributions?

Statisical Distributions are important because:
- They provide a quick, visual overview over how your data are distributed in terms
of frequencies (how many times did a given value of x occur?). Therefore,
Always graph your data
- The shape of your distribution intuitively tells you how well the avearge value of the
data is determined and the degree of variability around that average. One can, of course,
formalize this in terms of means and standard deviation.
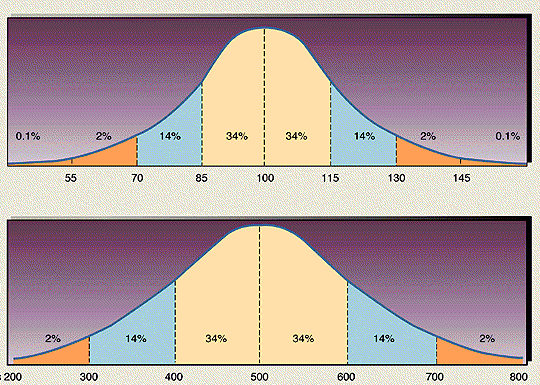
Most phenomena in nature are distributed via the bell shaped distribution (more formally known as a Gaussian distribution). This is a reflection of the "Law of Large Numbers" that we will discuss later.
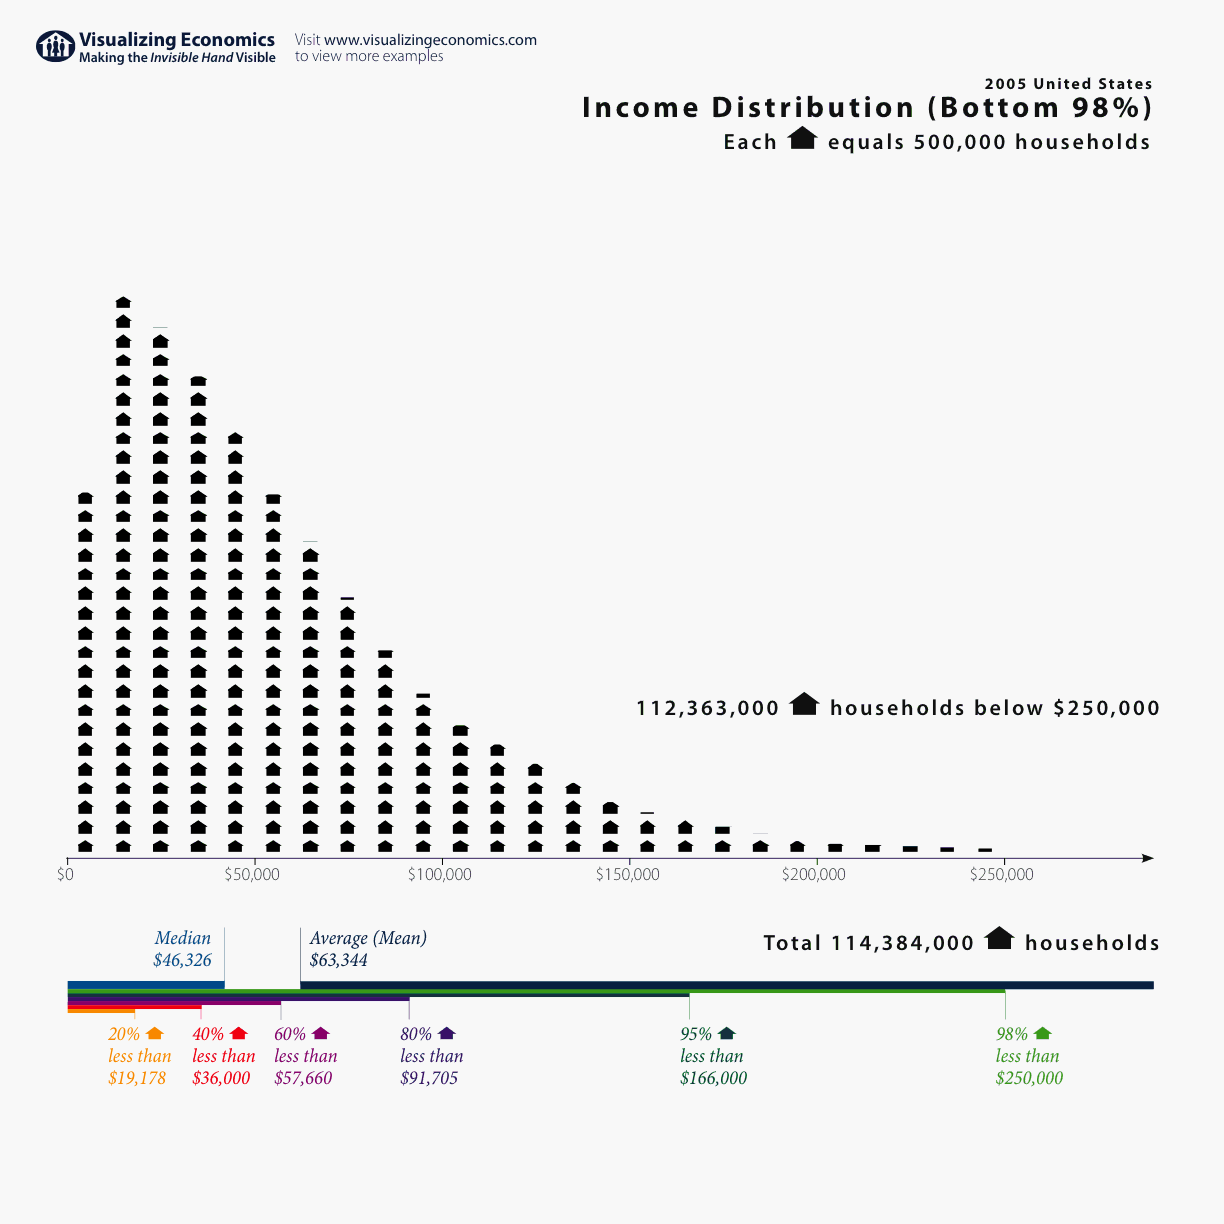
However, there are many occurences where the distribution deviates from a symmetric bell-shaped distribution to an ayssmetric distribution as the result of the existence of physical limits. This is known as a skewed distribution. In a skewed distribution the median is different from the mean. The higher the skewness the greater the difference and the more misleading it is to use the mean of that distribution as a statistic.

A good example of this issue is provided by the distribution of household income in the US:

Most all of science and most all of problem solving and discovery in science results from the analysis of the statistical distribution of some phenomenon:
-
Statistical distributions provide a mechanism for determining, reliably, the probability of some
event or value of x occurring.
- Tools exist to determine if two distributions are the same or not, to within the errors. This is a very powerful technique for trying to identify if external influences
change the behavior of the observed phenomena from one case to another.
This is particular relevant to environmental issues.
- Most importantly, statistics have predictive power, provided that you have an accurate determination of what kind of distribution best fits the data. This usually involves some higher order thinking/math which we will get to later in this course.
This then leads an an operational methodolgy for putting
statistics to work.
-
Define some environmental problem in terms of whether or not
it actually exists.
- Design a data acquisition strategy that can actually address the individual issues raised above.
- Go out and get the data in an unbiased manner and get enough of
it so that you can do statistics. (Small number statistics are one
of the greatest curses on science that there is).
- Perform unbiased data analysis and go where the data leads (note where your personal bias leads)
 this is the critical distinction between good science and bad science.
- Develop policies and solution spaces based on premises that can be defended and are consistent with the available data
 DATA CENTERED POLICY


 this is the critical distinction between good science and bad science.
 DATA CENTERED POLICY