Asymmetric Normal distributions:
Strong negative skewness:
Strong positive skewnewss:
Weaker positive skewness:
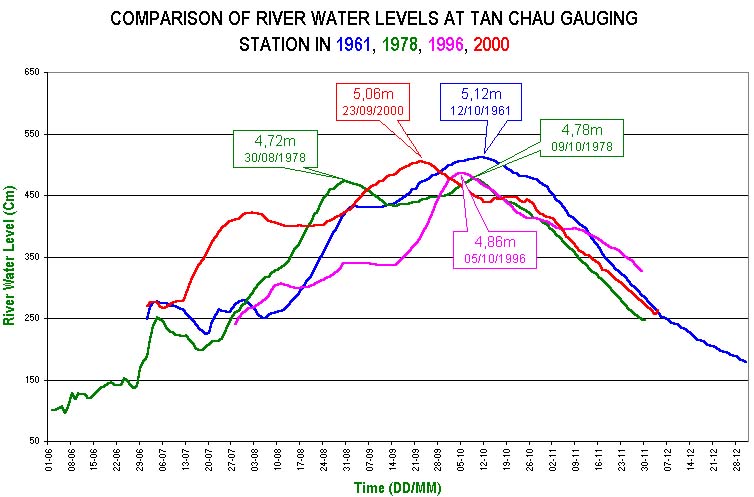
However, nature does often exhibit a skewed distribution when there is a physical limit in the system. Flood stage levels are a good example as there is no such physical thing as a negative flood stage:
Probability density function: the total area under the curve above represents all of probability space. If you took the ratio between of the area between, say the mode and median lines, and the total area, then that would tell you the probability that your observed value (X-axis) would be in that range.
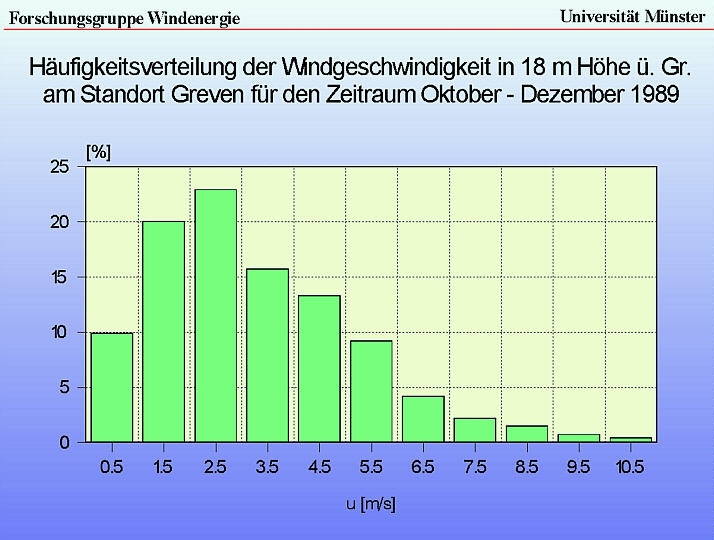
Negatively skewed distributions (more small values than large values) are usually better approximated by something called the Weibull Distribution:
This distribution is governed by two parameters: a "shape" parameter and as "width" parameter. A good example of a natural resource that is well fit by this distribution is wind velocities. That example and others Time to do the excel examples now.
The Weibull Distribution  applicable to wind load data (and
maybe floods)
applicable to wind load data (and
maybe floods)