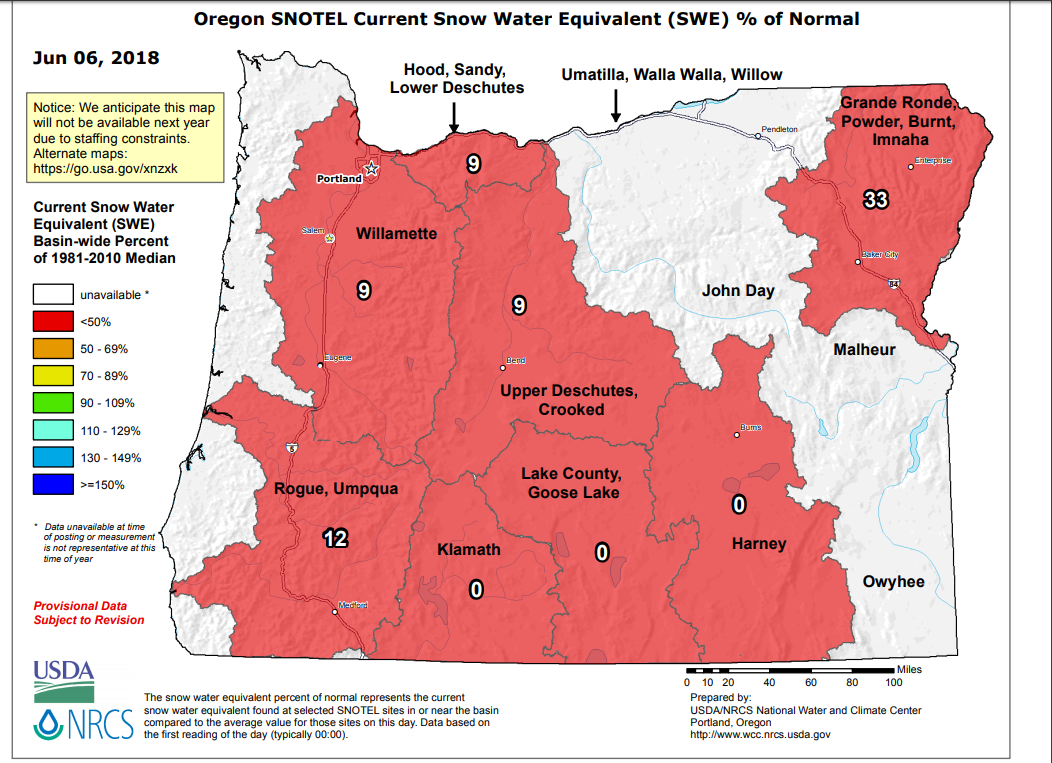
Here are the last 10 years for the number of days
with measureable precipitation during the equivalent
forecasting time:
| year | Number of Days |
| 2017 | 12 |
| 2016 | 11 |
| 2015 | 10 |
| 2014 | 8 |
| 2013 | 13 |
| 2012 | 15 |
| 2011 | 21 |
| 2010 | 25 |
| 2009 | 6 |
| 2008 | 16 |
What is the probablity of getting 0 events? (Note can't use possion statistics)
Average = 13.7 days per period; standard deviation = 5.7 = 2.4 σ or 1%
But 2010 was an anamolous year, through that out and you get
12.5 +/- 4.4 or 2.85 σ or 1 in 500.
| year | May inches |
| 2017 | 1.25 |
| 2016 | 1.34 |
| 2015 | 0.94 |
| 2014 | 1.66 |
| 2013 | 2.04 |
| 2012 | 2.7 |
| 2011 | 2.72 |
| 2010 | 3.78 (Late May) |
| 2009 | 3.07 (early May) |
| 2008 | 0.6 |
May 2018 = 0.44 inches (all in early May)
Look around and you will see lawns starting to
dry up, as if it was mid August.

|