All resource usage and/or pollution will
grow exponentially but with different couplings to the population
growth this is extremely relevant to
greenhouse gas emissions which we will discuss later.
Returning to the theme of the very first "lecture in this class" regarding
objectivity and science:
In general, decision making is done at the self-interest level.
With exponential resource usage, such decision making is extremely
destructive. What we need is convergence on the least "bad" option.
The ability to discern amoung
the least bad alternatives is extremely difficult. Politics and
pseudo-experts come into play. Science can help, but still the
process is quite inexact.
The self-interest decision making is encouraged because we do
a very bad job at "training" and educating people to look at the data.
We do an even worse job at presenting the raw data for objective
analysis. Instead, we are a nation and community of SPIN doctors.
This causes people to argue from a position of belief rather than
a position of knowledge.
Now, of course, the problem is made worse by the perception that we
are all afraid of math and that "formulas" don't apply to real life.
"Math, formulas and other things that don't apply to real life"
(--anonymous comment from student evaluation
as the part they liked least about the course)
So we live in a society that is afraid of and doesn't understand
numbers.
This again is a recipe for disaster as
it means the public can be sold most anything
Clearly, Exponential growth, in general, is not understood by
the lay public. If exponential use of a resource is
not accounted for in planning - disaster can happen.
The difference between linear growth and exponential
growth is astonishing. Exponential growth means that some quantity
grows by a fixed percentage rate from one year
to the next.
In this animation, one can clearly see that no matter what the growth
rate is, exponential growth starts out being in a period of slow
growth and then quickly changes over to rapid growth with
a characteristic doubling time. Dr. Nuts gives a video
explanation below.
Rabbits Run Amuck
A handy formula for calculating
the doubling time for exponential growth is:
For exponential growth that is occuring but the data has not yet reached 2 doubling times, then during that time that growth appears to be linear and is often mistaken for that.
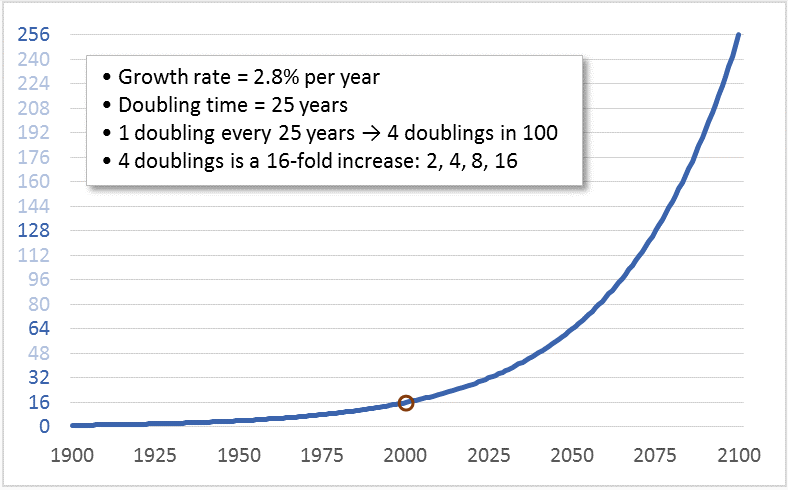
This is particularly true for consumption that is growing at a rate of 2% of less. Exponential growth as shown as a function of doubling times is shown below. For any problems assigned in this class you can use doubling times as as estimate for future
predictions. For the example shown below, the growth rate is 2.8% meaning the doubling time is 70/2.8 = 25 years. So you can see from the form of the graph that, at this rate of exponential growth (what we call k) the growth still looks linear after 50 years has passed (1900- 1950). Remember the rabbit example because assumed linear growth extrapolated now to the future will greatly underestimate the future.
A good example of poor public understanding.
A survey of Boulder Colorado residents about the optimal size for
growth returned a result that most residents thought that
a growth in population at the rate of 10% per year was desirable.
Well 10% a year may not seem innocuous but let's see how
these numbers would add up?
Year 1 60,000
Year 2 66,000
year 3 72,600
Year 4 79,860
Year 5 87,846
Year 6 96,630
year 7 106,294
Year 8 116,923
So in 7 years (year 2--7) the population has almost doubled and by then
10,000 new residents per year are moving to Boulder!
If one had asked the question on the survey:
Is it desirable for the population of Boulder to double in 7 years,
there would have been an overwhelming NO. Clearly, the general population
can not equate 10% growth rate with 7 year doubling time.
In exponential growth,
the rate of growth may well change, but the growth is
still exponential!
As will be covered later, the world's population is still growing exponentially, but the rate of growth continues to decline each year, and that results in BOUNDED exponential growth. This means the world population will reach a plateau and then start to decline.
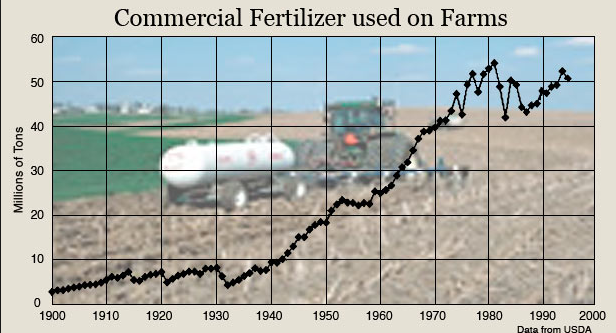
Often times when the exponential growth rate is large, the resource is rapidly reaches a peak (i.e. Hubbert's Peak) and then a search for substitutes, if possible, starts to occur. This is definitely the case for fertilizer use and "natural" fertilizers were used rapidly until a search for synthetic kinds of feritizliers became necessary, as the demand for global food continues to rise.
The value of the growth rate can be easily derived from the data:
Determine the Final Value
Determine the Initial value
Divide the two: Final/Initial
Take the natural log of that number: LN(Final/Inital
Divide that by the years between initial and final
numerical answer is the growth rate
In general one can do this exercise by just estimating values from a graph:
Example:
Number of Building Permits in Pasco WA
Growth Rate:
initial value (1992) = 400
final value (2000) = 1600
ratio of final/initial = 4
natural log (ln) 4 = 1.39
over 9 years, growth rate is then 1.39/9 = 15.4% per year
doubling time is 70/15.4 = 4.5 years (and the sample has doubled
twice from 400 to 1600 in 9 years self consistent
For this example in google just type: ln(4)/9
For the fertilizer example above over the period 1930-1970:
1970 use ~ 40 ; 1930 use ~ 10 ; ratio = 4 so ln(4)/40 = 3% (not suprisingly the same as the growth of oil consumption)
What kinds of things grow exponentially?
Population
Energy resource use
Number of shopping malls
Number of automobiles on the freeway
Number of Cell Phones
Number of lawyers on the planet
amount of paper used
Internet usage
Clearly exponential rates of growth are an integral part of
the planning process. Different aspects of a growing population
have different exponential growth rates and these need to be
considered.
For instance, suppose your urban area is growing
at the rate of 5% a year. How does this translate into the
following:
Number of extra road miles that need to be built?
Number of extra schools that need to be built (currently
a problem in the Eugene Area)
Price of housing and affordability of housing.
zoning regulations
amount of wetland mitigation to be done in the future
growth of fire, police, sanitary and hospital services?
The need to make reservations for campgrounds at State Parks?
And finally, here is an example of growth from 1950-2000 for a variety of real things that have highly different rates. This shows that different things have different scaling growth factors with respect to an exponentially growing consumer population.
The table below shows some other examples of non-linear scaling over the period 1950 -- 2000.


 this is extremely relevant to
greenhouse gas emissions which we will discuss later.
this is extremely relevant to
greenhouse gas emissions which we will discuss later.