The actual salmon count data shown as a histogram of the number of years where the salmon counts landed in the indicated bins. (Bins are 50,000 salmon counts wide.)
 This distribution, defined by 44 points, has a mean of 358,000 salmon with a standard of 82,000 salmon. The error in the mean is 12,000 (82000/(square root of 44)) Points to note about the distribution:
There has been some speculation and data that suggest there has been a decline of salmon recently in the Columbia River System. What do these data say? Here is the distribution of the data with the last 5 years subtracted out, so there are 39 years worth of data:
 This distribution, defined by 39 points, has a mean of 368,000 salmon with a standard deviation of 81,000 salmon and a mean error of 13,000.
Note: The standard deviation for the 39 year sample and the 44 year sample
are similar Over the last 5 years, the data are defined by an average of 278,000 salmon with a standard deviation of 33,000 and a mean error of 15,000 = (33,000/(sqrt of 5)). Does this data show a significant decline of salmon? Well, we could plug our means and mean errors into the formula for the Z-test and likely make arithmetic errors. Instead plug the numbers into The Z-test tool.
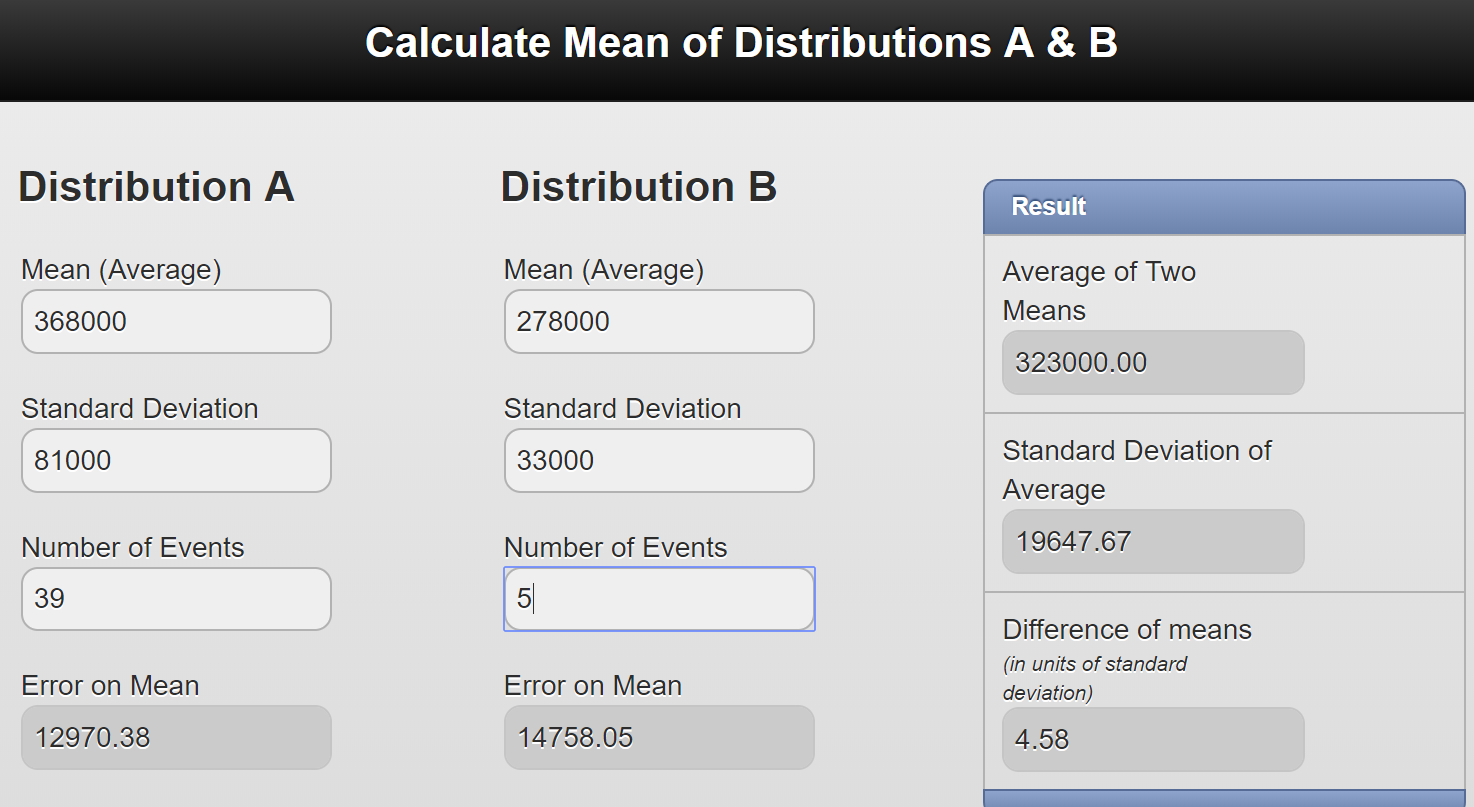 You should find a Z-statistic of 4.6 indicating high significance. Hence, in 1996, you could have used statistics to definitively show a strong decline in the salmon population. However, this would require that the 44 year sample is an accurate reflection of the general phenomena and, as it will turn out, salmon counts/abundance are highly cyclical in nature and that 44 year snapshot of the population from one dam is not representative. (Note that it will turn out that salmon counts will start to strongly rise in the late 90's.)
|
 this indicates that we have enough data to accurately
determine the standard deviation.
this indicates that we have enough data to accurately
determine the standard deviation.