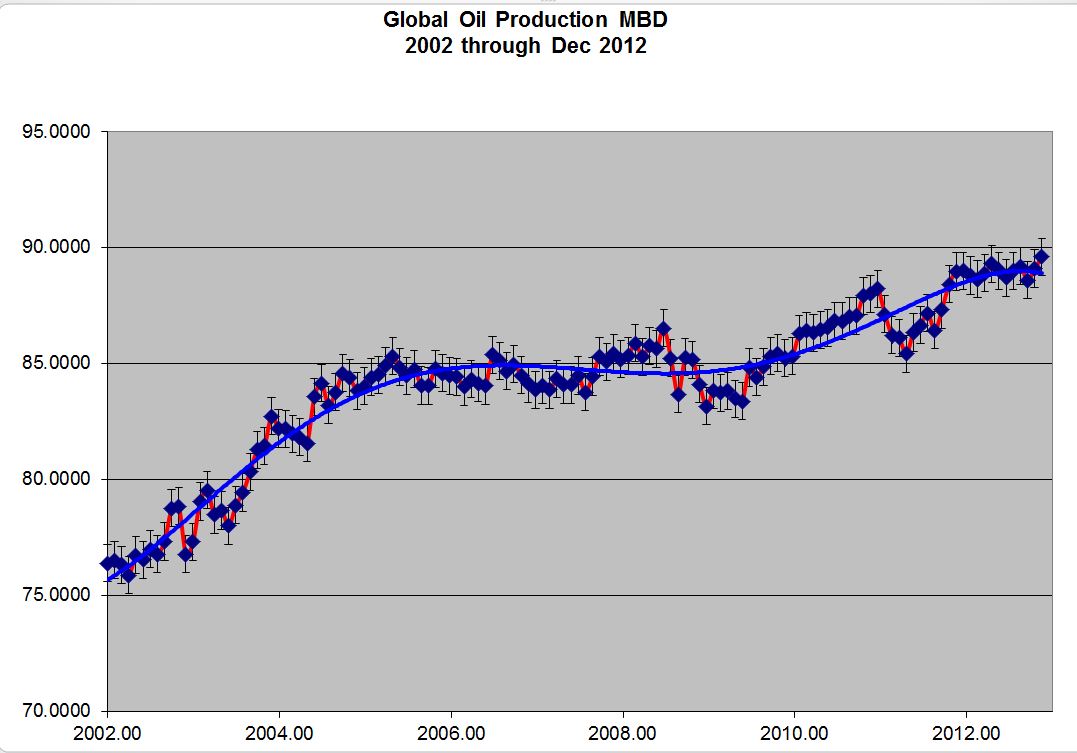
The reason that "Peak Oil" is really "Plateau Oil" is because our
worldwide infrastructure supports the processing of about 90 million barrels a day (MBD) and we have now approached that and have been in the flat part of this distribution curve since 2005 but no one
in America seems to know this. Indeed, supply and demand have no been really involved in oil pricing for some time, since the supply has been physically limited by the number of operational refineries on the planet.
The current situation for the world can best be summarized in the graphic below. Consumption and production are the same for crude oil. As will be discussed later, we do not store any appreciable amount of crude oil, therefore every barrell that is taken from the ground is essentially immediately consumped. The graphic below shows that consumption has been about 91 +/- 1 MBD for the last several years. The black line shows the increasing gap between demand and the physically ability to meet that demand. 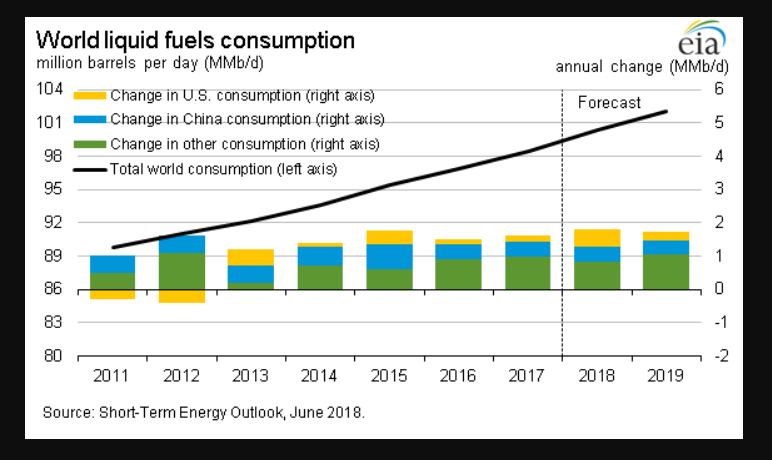
In reality, plateau oil is actually good because its preventing the world from demand scaling thus extending the usable lifetime of the world's reserves. Under the current plateau reserves exist to supply another 30 +/- 5 years of oil at current consumption levels. If demand scaling were to be supported then a) we would exhaust the remaining known oil in about 12--15 years and b) we would be putting even more carbon into the atmosphere. To put things in perspective, the following figure shows the evolution of global refininery capacity from the period 1970 -2017. Although we have gained about 4-5 MBD capacity since 2012 this represents only a 6% increase in available world supply. That's a tremendous amount of effort needed to build and maintain new refineries for a very small increase in the global supply. Indeed, why doesn't every one just drive 6% less to avoid the need for additional refiniery infrastructure! 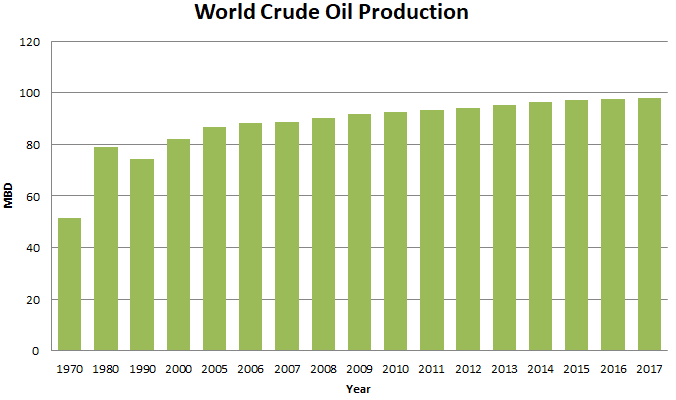 Note: the dip in production in 1990 is due to the destruction of the Oil Fields in Kuwait. US Crude Oil Imports Another mythology to be dealt with is the Import portfolio for American oil use (primarily gasoline). The total import portfolio over the last few years is shown here, were on average 10 MBD are import. Our total use averages about 20 MBD over this period, so 50% of our oil comes from foreign sources (see more below). In recent years, Oil Imports have gone down a bit due to new fields of local production, primarily in North Texas and North Dakota. 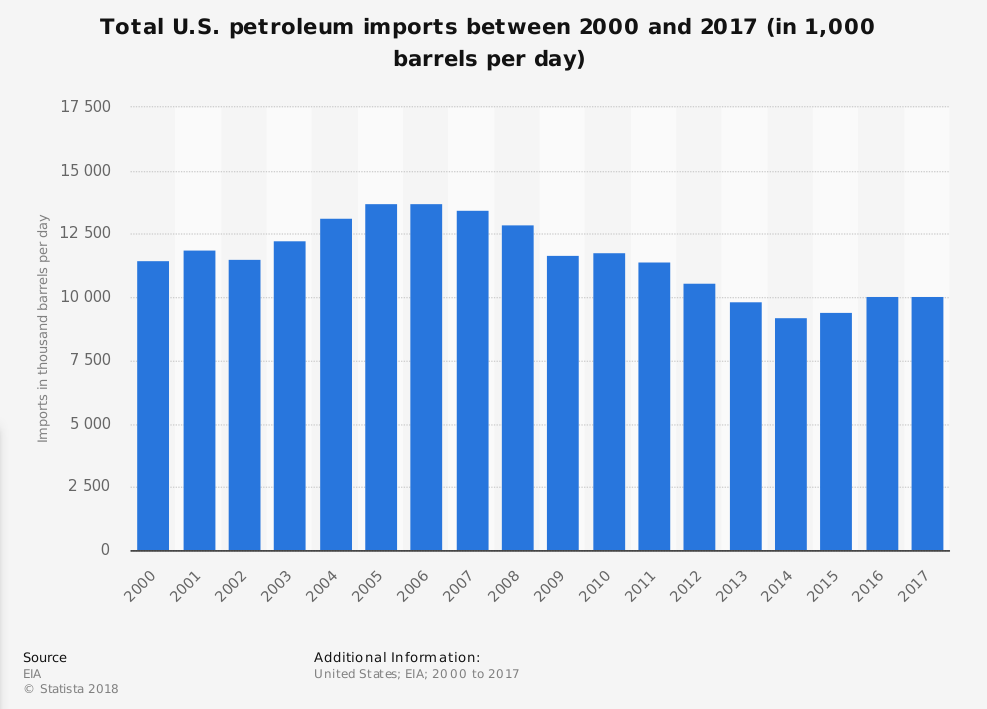
However, most of this imported oil does not from the Middle East and it never has. The image below is the situation as of January 2015 for the top 5 sources of import. 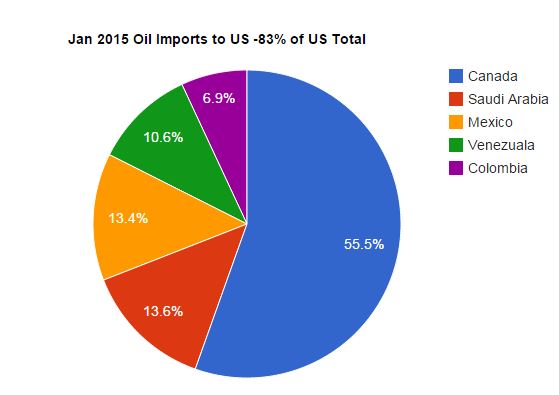 But the same 5 countries shown in the 2015 snapshot are prevelant throughout the last 30 years 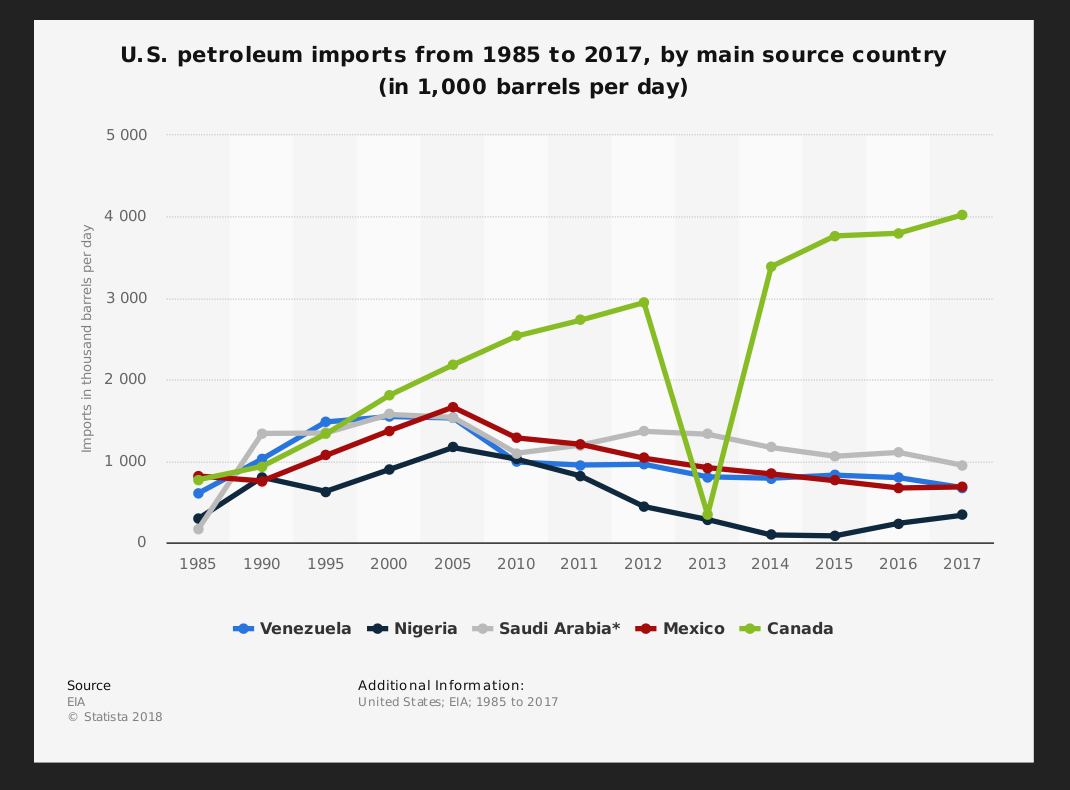
The most current data on US imports can be found from the EIA Currently Iraq has now replaced Nigeria as one of the top importing nations. Current data on weekly petroleum consumption can be found here and indicates a near constant consumption of 20 MBD over the last 10 years: 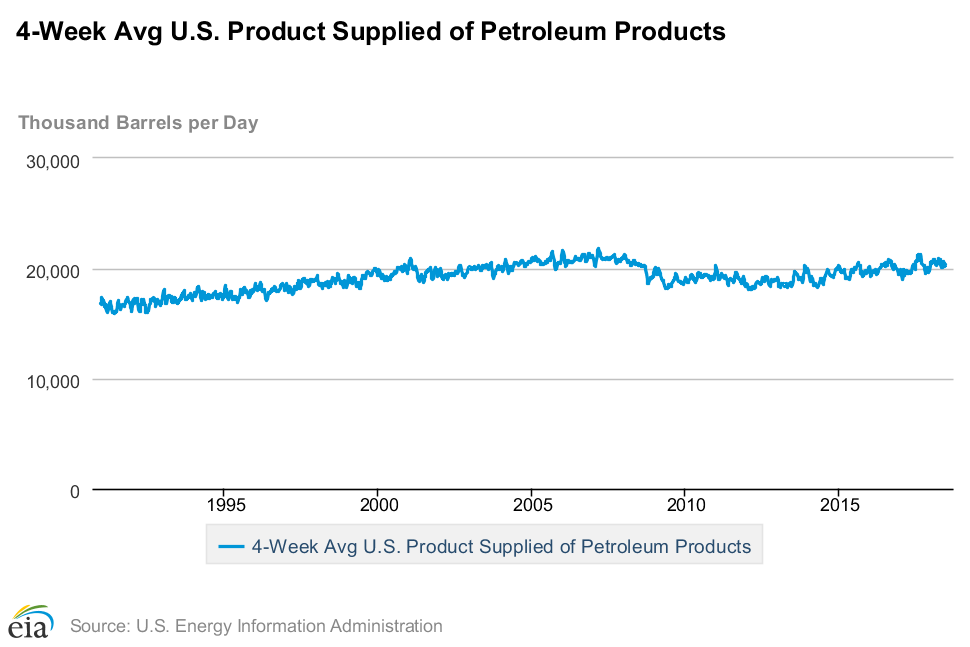 Canada Oil Imports: As Canada continues to process the Athabascan Tar Sands they are squeezing more barrels out. But consider the context again in terms of the world 95 MBD use (limit). The environmental cost of Canada ramping up from 2.5 MBD in the year 2000 to about 5 MBD currently is gigantic compared to the rather minimal increase in world supply. 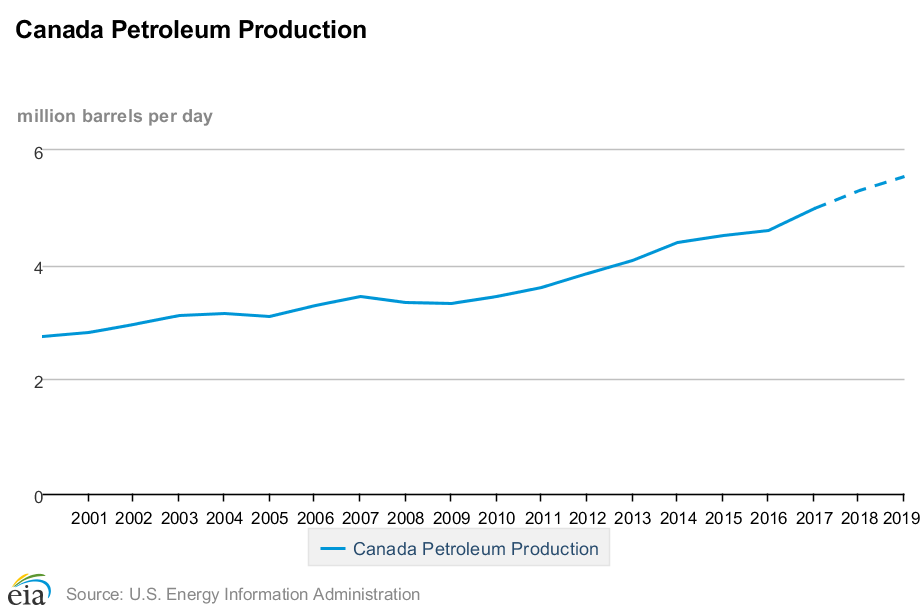 But more Canadian Oil means more petroleum imports to the US and hence the need for expanding the Keystone pipeline: 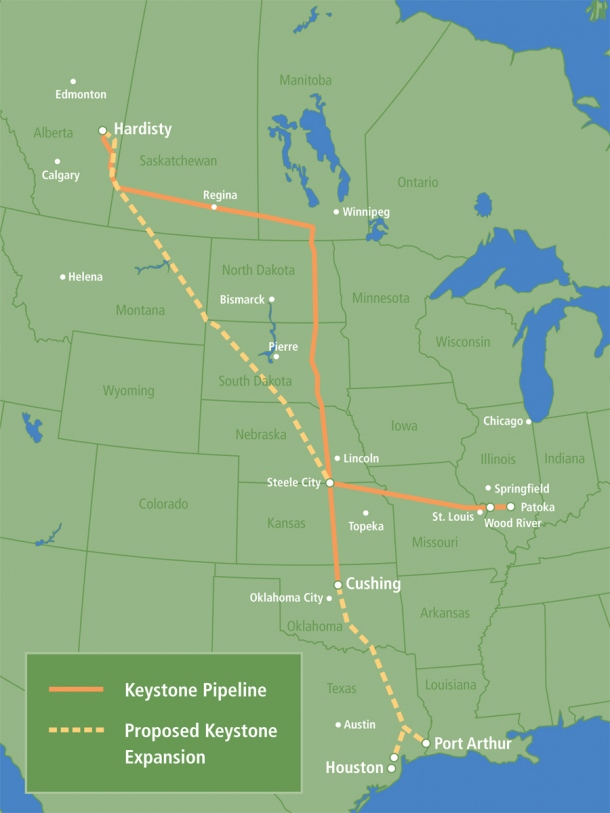 For a good example of the impact this project has on the local community, watch this: |