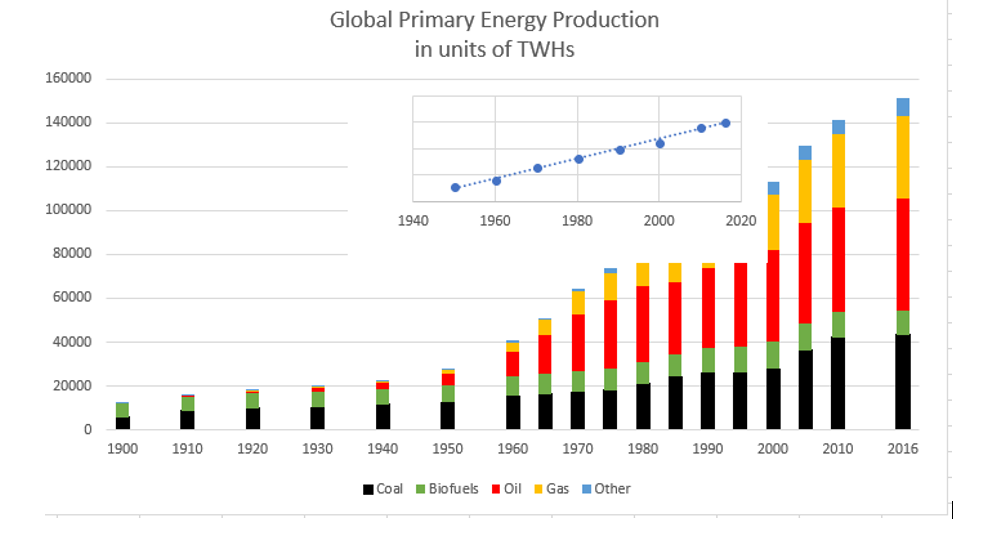
The figure above summarizes the global energy mix and its evolution since 1900. There is a lot of information in this figure and some of the highlights are:
- On the global scale, energy use significantly ramped up following World War 2. Total energy use from 1900 to 1945 was equivalent to use from 1950 --1970.
- From 1950 until 2016 growth of world energy consumption is very linear with a slope of ~ 1900 TWHs per year increase. This is shown as the inset linear fit graph in Figure 7. This linear fit implies world energy usage of 215,000 TWHs by 2050.
- Coal production slowly increases by a factor of 2.2 from 1900 to 1950 as well as 1950 -- 2000. The post 2000 in coal production is due to the emergence of large scale China coal production which starts around 2003. Specifically, from 2003 to 2013 world coal increased by a factor of 1.42 in just those 10 years. However, recent energy policy changes in China have now somewhat abated this large growth rate.
- Oil growth is explosive. Since 1950 annual production of oil has increased by a factor of ~9.5. However, since 2005 oil growth has been strongly limited by world refining capability and this has lead to "plateau oil" as the proper description of the future depletion of crude oil.
- NG is experiencing very strong growth. Unlike oil, various NG refining and distribution facilities can be more easily built which can better meet demand. As a result, over the time period of 2000-2016 NG global distribution increased by a factor of ~ 1.5 compared to a factor of ~1.1 for oil. Currently there are very large gas reserves -- not yet available for worldwide -- use in Russia and Iran.
- Biofuels are dominated by the burning of wood followed by the use of grain-based ethanol as a fuel source for transportation. Annual uses of biofuels increase throughout the 20th century by a small factor of 2 compared to a factor of 3.8 increase in world population.
- Other: This sector is historically dominated by hydroelectricity. Nuclear power emerges in the 1970s and wind and solar are not statistically relevant until about 2005. If we define the 5% level as a significant contribution to the world's energy mix, then the "other" sector this does not become significant until 2000. Since 1990, production in these sources has gone up by about a factor of 1.98. While encouraging, this production rate has to become much larger in order for these "other" sources to replace fossil fuel sources in the global energy mix.
Individual country profiles can have very large variations due to local environmental conditions. For example, Canada has the highest per capita energy consumption because of significant heating requirements. Similarly, Norway has tremendous hydroelectric resources along with a relatively small population so it can be powered by 100% renewable energy. Any country's energy mix will depend on some ratio of available resources to in country demand. More specifically the country or regional energy mix depends on:
- The availability of usable resources that can be domestically harvested in an efficient manner. If the resource is insufficient to meet regional demand then importation is required.
- The types of energy needed to be met. For instance, if transportation dominates the energy use portfolio, then that requires a much different fuel mix would be required if electrical consumption or heating (e.g. Canada) dominates total energy use.
- Particular country policy choices for energy are often primarily determined by socio-economic factors or geo-political considerations. For example, in the early 1970s, France decided to invest heavily in its own nuclear facilities to avoid an escalating dependence on fuel stocks from the Middle East. Germany's strong renewable energy efforts are partly motivated by a desire to become independent of future need for NG as that resource would be provided by Russia via pipelines flowing through the Ukraine.
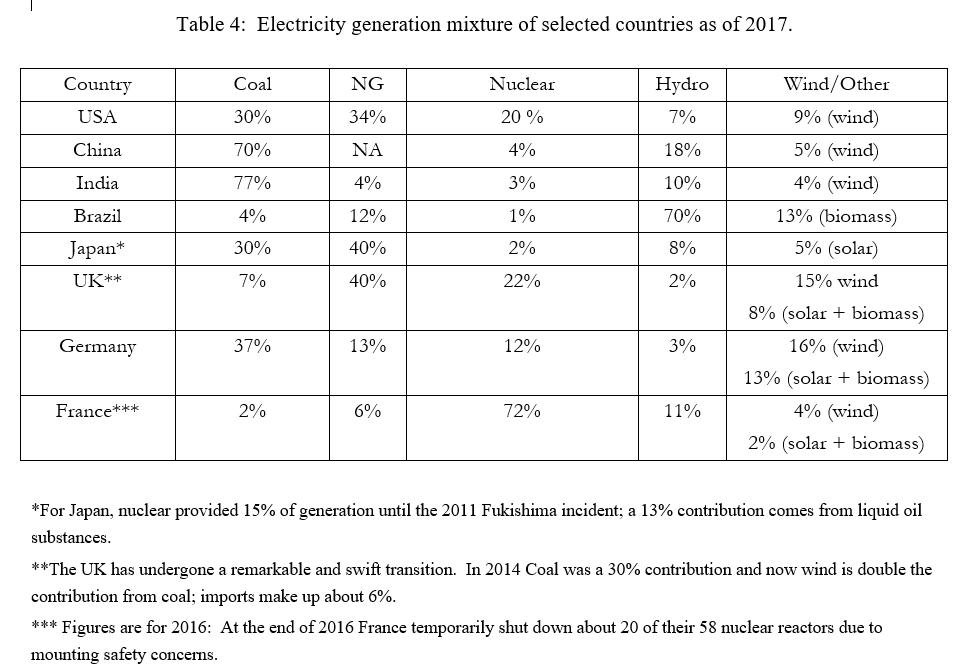
In addition, an energy mix is not the same as a power generation mix which is the use of different energy sources that can be used to generate electricity. Table 4 lists electricity generation mix for some selected countries.
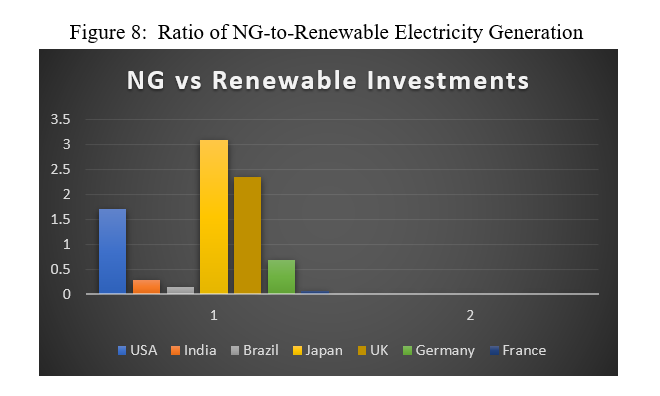
It is insightful to compare the respective reliance on NG vs renewables for various countries. While the use of NG might be a good short-term resource to meet increasing electricity demand it nonetheless retains reliance on fossil fuels. In contrast, increasing use of renewables is much more aligned with a longer-term goal of reducing overall fossil fuel usage. Figure 8 shows the ratio of NG to renewables for the countries in Table 4. This ratio can be considered as indicator for an individual country's commitment to the expanded use of renewable sources of electricity generation. Clearly the US, Japan, and the UK have heavy investments in NG whereas India, Brazil and France have decided not to take this route. The strategy of Germany lies somewhere in the middle of these two extremes.
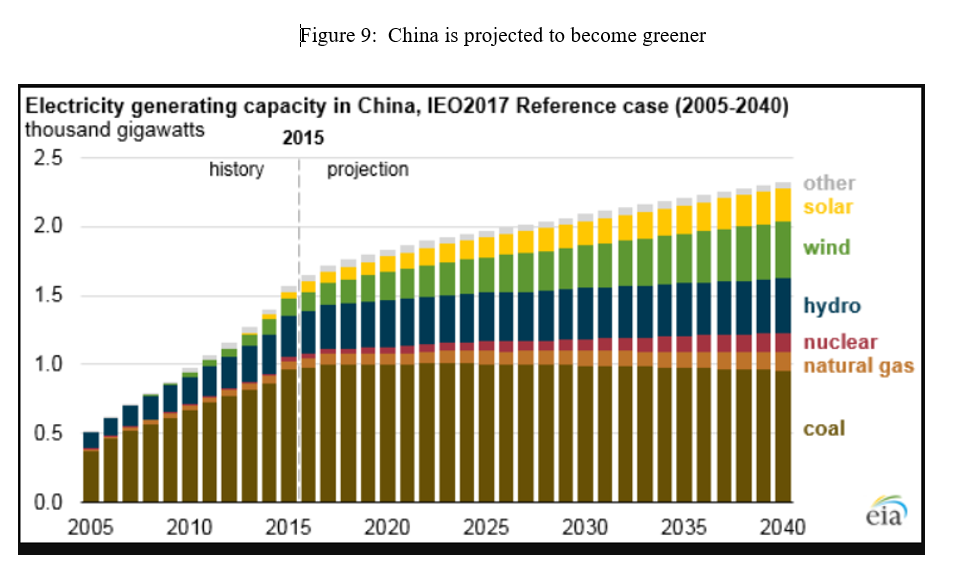
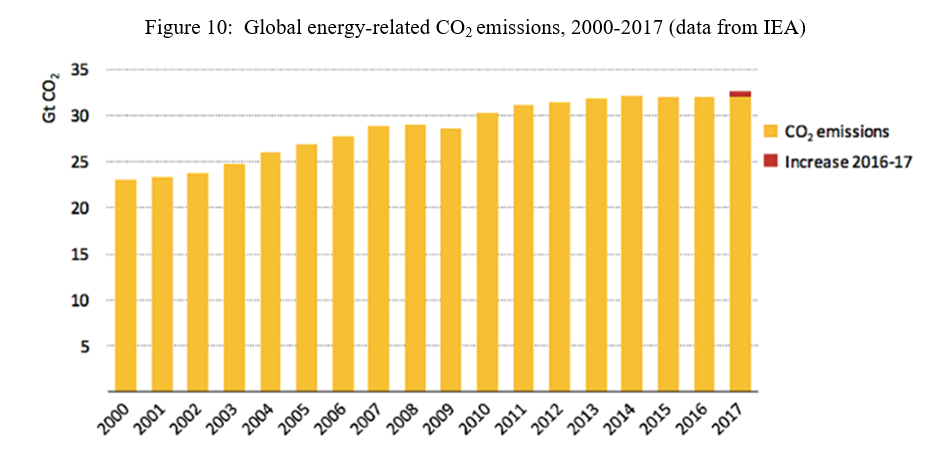
The case of China is different. China has no need to import NG due to its tremendous coal reserves. Indeed, the challenge for China is whether to continue to burn all of that reserve or to move to more renewable energy sources. A major governmental policy shift did occur in China in 2015 which committed to building out more renewable energy resources and fewer newly constructed coal-fired electricity plants. This transition can be seen in Figure 9 and currently China is making strong progress in constructing alternatives to coal and avoiding the use of NG as much as is practical. This is a noteworthy change from past behavior and dire predictions about China's continued reliance on coal. In turn this has lead to a situation where CO2 emissions that are related to energy generation (Figure 10) have essentially plateaued (though there is a small uptick in 2017). Part of this plateau is related to warmer than average winters in most of Europe the last few years. Increases in global CO2 emissions are now largely driven by increases in transportation and its continued reliance of oil as the primary fuel source.
|