Properties of Greenhouse Gases
Many GHGS occur naturally in the atmosphere. The important ones for the Earth system are:
- Water vapor
- Carbon dioxide (CO2)
- Methane (CH4)
- Ozone (O3)
- Nitrous Oxide (N2O)
Other GHGS are man-made and include:
- chlorofluorocarbons (CFCs)
- hydrofluorocarbons (HFCs)
- Perfluorocarbons (PFCs)
- sulphur hexafluoride (SF6)
While CO2 is naturally occurring in our atmosphere (from respiration for example) human activities have
served to augment its natural concentration. This augmentation occurs through human interference with
the carbon cycle either by changing surface vegetation patterns or burning fossil fuels. The end result is
that carbon is artificially moved from its natural state storage as a solid to its new state as a gas in the
atmosphere.
The relevant properties of each of the previously listed GHGS are:
Water Vapor:
As shown before, by percentage, water vapor absorbs more of the IR emission spectrum of the Earth
than any other gas. However, water vapor does not regulate the Earth's temperature (like CO2 does) but instead its
atmospheric concentration responds to the Earth's temperature. This is simply because warmer air can hold
more moisture. In terms of geologic time, feedback warming from naturally occurring CO2 (mostly from
volcanic emissions) raised the atmospheric temperature sufficiently so it could hold more water vapor
which in turn amplifies the amount of surface emission. Now we are in the opposite situation where human
caused escalations in atmospheric CO2 concentration potentially allows the atmosphere to absorb even more
water vaporwhich would add to the overall
warming. This is known as the water vapor feedback loop.
The atmosphere, however, cannot hold arbitrarily large amounts of water vapor and is self-limiting
in that regard.
When too much water vapor
is added to the atmosphere, via evaporation of surface water, then local volumes of air become saturated
and clouds form which then can release liquid water back to the surface (precipitation). Globally, the
evaporation rates and precipitation rates are in some kind of equilibrium averaged over many decades. In
this way the atmosphere can not gain or lose water on these time scales, but on shorter timescales, the water
vapor concentration may be temporarily out of balance.
In general, water vapor concentration increases by 7% per degree Celsius rise in atmospheric
temperature. If CO2 induced warming has now reached the level of 1.5 C, then there should be ~10% more water vapor in the atmosphere. This does not
necessarily mean that there are more clouds as this extra water vapor doesn't necessarily have to condense
out. This is the nature of the water vapor feedback loop and some suggest that this loop is
already leading to surface warming.
Carbon Dioxide
Carbon moves through the Earth-atmosphere-ocean system via the carbon cycle shown in Figure 4
where the black numbers represent the size of the reservoir and the exchange rates that are natural to the
system. Red numbers represent the artificial changes to these natural exchange rates due to human
activities.
Figure 4: IPCC representation of the Carbon Cycle
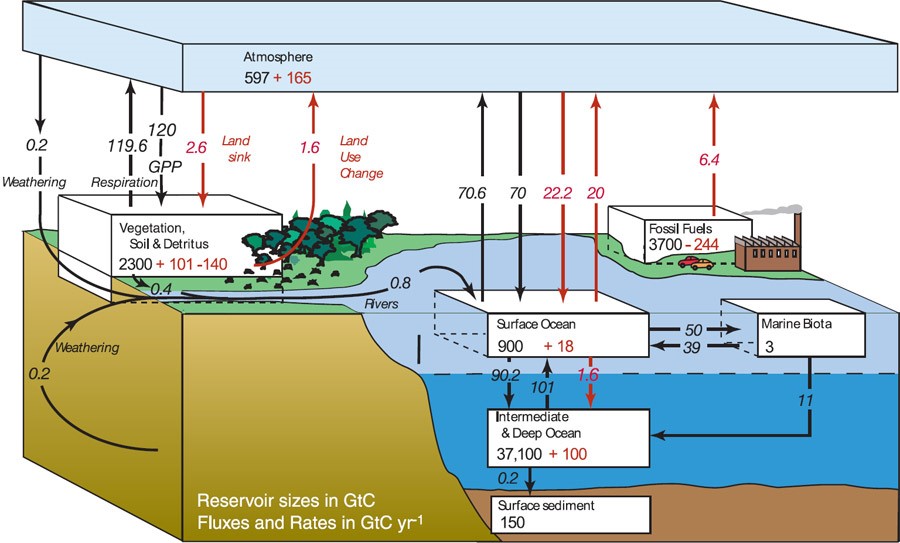
This situation where human activities have reached a scale where they can directly alter these
natural exchange rates is known as the Anthropocene. The values for human influences
represent the state of the carbon cycle in the mid-1990s but it is not necessary to update them for the
purposes of the following discussion.
From this diagram we see that the natural sources of Carbon in the atmosphere come mainly from
terrestrial respiration by various organisms and from surface ocean processes. These processes have
seasonal levels of activity. For example, the northern hemisphere (NH) has considerably more landmass
and vegetation than the southern hemisphere. As a result, the NH is a more active sink for atmospheric
CO2 removal in the spring and summer as plants drawdown CO2 through photosynthesis. This temporary
storage of Carbon is then released in the fall and winter as the plants decompose. The other major source
of drawdown involves the solubility of CO2 in seawater. However, the efficiency of that process is very
dependent on the sea surface temperature (SST) as higher temperature ocean water has less ability to
dissolve CO2.
The exchange rates between the atmosphere and the ocean are complex and depend upon a
number of factors therefore exact removal rates are
unknown. Most estimates suggest that 65--80% of atmospheric CO2 can be dissolved over a 200-year
timescale. As SST continues to climb, this dissolution rate will be lower and it will take a longer time for
ocean-based removal of atmospheric CO2 . Hence if atmospheric CO2 builds up in a relatively short amount
of time (e.g. 100 years) then it will remain there as this increased deposition rate is much larger than the
natural carbon sinks can accommodate.
Methane:
Methane (CH4) is physically a much bigger molecule than carbon dioxide. As result it is a far more
efficient absorber of IR radiation. The overall concentration of methane is about 250 times smaller than
CO2 and so it does not yet dominate the total absorption profile. In addition, the lifetime in the atmosphere
of an individual methane molecule is rather brief as its highly chemically reactive and easily combines with
various atmospheric hydroxyls (OH-
) so as to mix out in 1--12 years. Note that the end product of this
chemical reaction is the conversion of CH4 into CO2 + water vapor. But the global warming power of those
two GHGS is much less than methane.
The global warming potential (GWP) of a gas is defined as the
amount of warming, relative to CO2 that would occur over 100 years. For water vapor, the concept of GWP
is meaningless as the residence time in the atmosphere of any increase in water vapor is just a few days.
The GWP of methane, however, remains somewhat uncertain as does the timescale over which to apply a
proper GWP value. For many years the IPCC used a value of 21 for methane but updated that to 34 in the
latest fifth assessment report. This updated value is partly based on a better understanding of methane
chemistry. In 2009 NASA researchers discovered that surface chemistry on methane molecules actually served
to dissolve some of the natural sulphur aerosols in the atmosphere. Since these aerosols act as global
coolants, their accelerated removal indirectly contributes to warming. Methane has both natural and
anthropogenic sources.
Natural sources of methane are generally based on methanogenesis resulting from
biological operations in certain microbes. This activity and subsequent release of methane is dominated by
wetlands. This release rate is about 3 times higher than the combined rates for methane released from
termite populations and from ocean processes. Approximately 30% of all methane emissions are natural,
the remaining 70% are the result of accelerated human activities in the following areas:
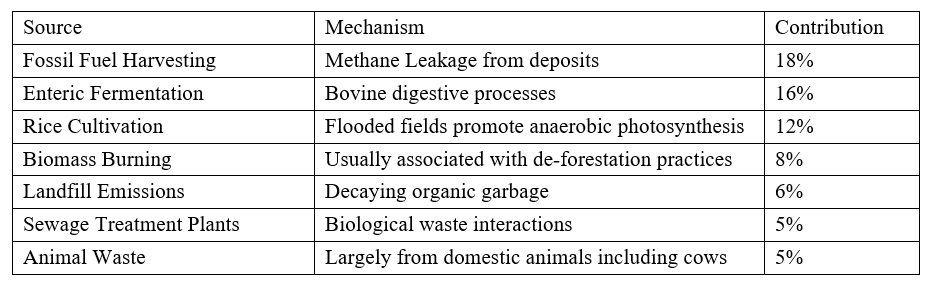
As the release of methane into the atmosphere is mostly anthropogenic in origin, then growth
directly corresponds to increasing human population which requires more food and subsequently produces
more waste. However, there is a potentially far more serious source of future methane releases involving
the de-stabilization of methane clathrates in the Arctic or those in marine sediments currently pressure
confined to stay at the bottom of the ocean. As the depth of the permafrost layer continues to rise in the
NH the tremendous methane reserves that are currently frozen
in the Siberian permafrost can be released. There is now good evidence that this is now
starting to happen as the Arctic is warming substantially faster than the rest of the planet. Similarly, as sea surface expansion occurs the total pressure overburden
of a column of water begins to decline, thus possibly releasing previously confined methane clathrates.
Ozone:
The physical structure of ozone allows for it to be an effective absorber in the IR. However, ozone
is somewhat unique among GHGS as its not globally distributed. The lifetime of ozone in the atmosphere
is so short, that any local release of ozone doesn't live long enough to become a global GHG. This is why
the concept of GWP doesn't apply to ozone. Ozone is an important catalyst for photochemical smog whose
concentration is strongly related to local automobile density. Hence around major urban centers ozone can
contribute to the general urban heat island effect by further inhibiting the ability for that environment to
cool down at night. Concentrations of ozone have increased by about 30% since pre-industrialized times
but this new GHG constituent is not likely responsible for any significant warming to date.
Nitrous Oxide:
Nitrous Oxide has a GWP of ~280 and thus could be a significant GHG if its concentration weren't
so low (its about 6 times lower than methane). Moreover, N2O is not very chemically reactive so once it
is deposited into the atmosphere it will stay there for an average lifetime of 114 years. While fossil-fuel
power plants and vehicle emissions release some N2O the major increase is coming from microbial
processes that occur in a nitrogen rich environment. Such an environment occurs with the widespread use
of fertilizer. The use of fertilizer in the 20th century far outpaced the rate of population growth and it is the
main reason that N2O levels have risen.
Chlorofluorocarbons:
Nature does not produce CFCs. CFCs along with CF4 (carbon tetrafluoride) and SF6 (sulphur
hexafluoride) are released primarily from refrigerants, aerosol propellants and cleaning solvents. These
particular gases have long atmospheric lifetimes (> 100 years) and high GWPs (> 1000). In most cases the
concentration of these high-GWPs gases is declining and their current concentrations are so low they are
unlikely to be a significant source of IR absorption by the atmosphere. HFCs (hydrofluorocarbons) also
have high GWP but they are highly chemically reactive and have very short atmospheric lifetimes and
therefore have low impact as a GHG.
Ironically, at least for the US, 92% of all fluorinated gas emissions
come from substances used as replacements for CFCs, the major cause of stratospheric ozone depletion.
The small remainder of emissions is from the use of these products in the manufacturing of semiconductors.
Overall, fluorinated gas emissions in the US have increased by about 74 % from 1990 to 2016,
primarily driven by a 250% increase in the use of HFCs as the primary substitute for ozone-depleting CFCs.
|