Our increasing annual greenhouse gas emissions
The issue of annual greenhouse gas emissions is a good example where the public belives in anecdotes and heresay, even though the data is readily available to reveal the truth. Here we use the data to do decadal averages of annual CO2 emissions and use the statistics previously discussed to establish various levels of significance.
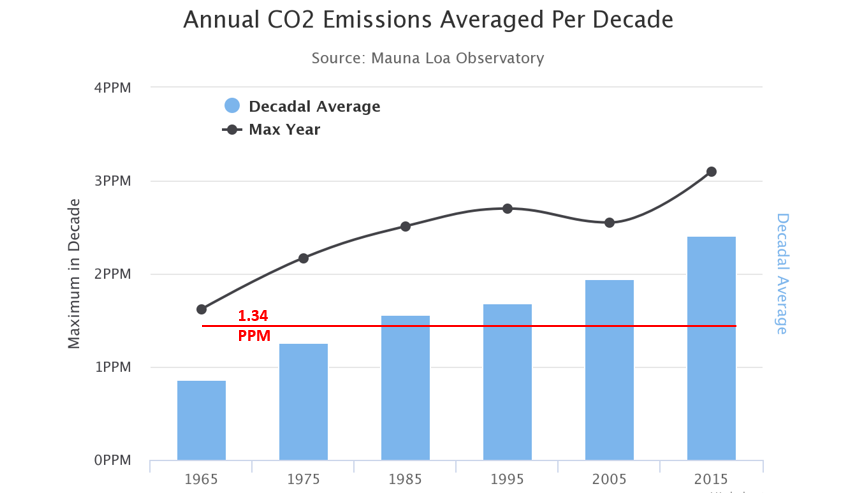
We start by using the observed concentration of atmospheric CO2 (in units of ppm) as the input and the global annual mean temperature anomaly ΔT as the output to examine non-linear behavior. In figure 2 we plot the decadal average of annual CO2emissions as measured at the Mauna Loa Observatory (http://scrippsco2.ucsd.edu/data/atmospheric_co2/) and show the maximum emission for a given year in that decade. For reference, the solid red line the Figure is the average annual emission over the period 1960-2000 (1.34 ppm).
Analysis of the Mauna Loa Data set shows:
- The current decadal annual increase in CO2 concentration is 2.41 +/- 0.38 ppm. This is almost twice as large as the 1.34+/- .36 ppm value during the 1960-2000 periods.
- For the current decade (2010), every single year has a larger annual emission than the long term 1960-2000 average of 1.34 ppm.
- For the previous 5 decades, the average annual emission rate is 1.46 +/- 0.42 ppm. This decade’s current value of 2.41 is 2.26 standard deviations larger than the previous decadal value. This increase has only a 1.2% probability of randomly occurring and therefore statistically indicates systematically increasing annual CO2 emissions and a more rapid buildup of atmospheric CO2, i.e. acceleration.
- If we extrapolate this observed increasing annual rate out to 2030 then we will be adding an additional 30-35 ppm reaching approximately 440 ppm by then. This pace rapidly hinders the overall ability to achieve atmospheric CO2 level stabilization; in particular, stabilization at 450 ppm now seems impossible.
The table below summarizes the decadal averages and their standard deviations below, from which we can apply the z-test to determine various levels of significance. There are 10 years in a decade, so N=10.
Note that the decade of the 90's is a bit anamalous because CO2 emissions were somewhat globally depressed due to
active volcanoes in the early 1990's (Pinatubo in particular).
For the data corresponding to the decade of the 1990s we have removed the anomalously low value for CO2 emissions in the two years following the Mt. Pinatubo eruption. This volcanic explosion temporarily changed atmospheric chemistry such that CO2 mixes out at a faster rate, leading to some reduction in average atmospheric concentration.
With that anomalous period removed, we find that the variation around the value for each of the decades is similar, although somewhat higher in the decades of the 1980s and 1990s. Overall, this indicates that while we have not (yet) significantly changed the natural variations in the annual CO2 emissions cycle, we have changed the zero-point of that cycle through systematically increased addition of CO2 to the atmosphere.
| Decade | Annual Emissions | Standard Deviation |
| 1960s | 0.71 ppm | 0.34 ppm |
| 1970s | 1.12 ppm | 0.43 ppm |
| 1980s | 1.41 ppm | 0.52 ppm |
| 1990s | 1.36 ppm | 0.58 ppm |
| 2000s | 1.84 ppm | 0.40 ppm |
| 2010s | 2.41 ppm | 0.38 ppm |
So we can then ask the question, is the current emissions rate (2.41 ppm per year), significantly larger then the 1990s emission rates of 1.36 ppm. Afterall, anyone elected to congress will simply say, yeah, so what if its 1 part per million higher, how cares, that's nothing.
Well the Earth system cares and will changed because the earth system understands what significant change actually means.
So we can simply use the Z-test tool to estimate the significant. For the current decade, there are 7 years that go into determining the average and standard deviation listed in the table above.
The results of entering in the numbers into the tool is shown below:
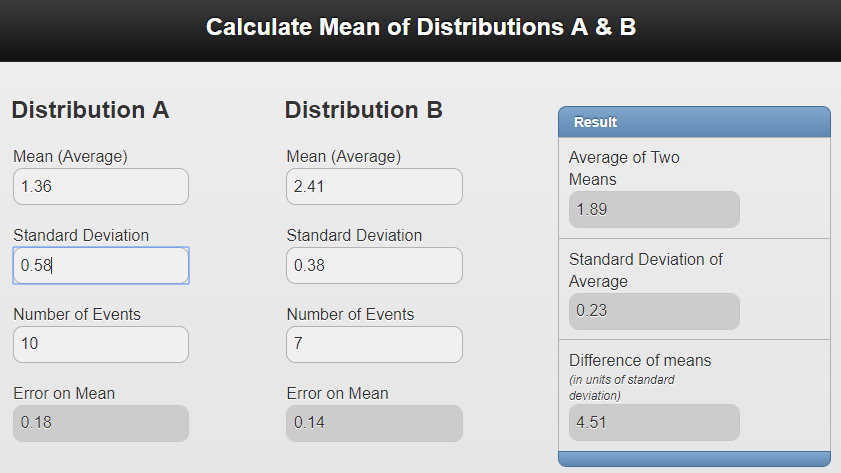
The result, 4.51, shows that there is a significant difference in annual greenhouse gas emissions. Despite the Paris accord, and all the rhetoric about green and sustainability, if you simply ask the Earth what does it see, then it responds that it sees a lot more atmospheric CO2 pollution than in the recent past. Our rates are accelerating, we we will see this acceleration repeatedly in the next section about the many dimensions of climate change. Numerical literacy matters; if there is none, then once again Disney's first law is really what your society operates on. Is that what you want? Do you even care?
|