Non Linear Growth
Although you are likely somewhat familiar with exponential growth, any growth that causes the output Y to be larger than the input X, is known as non-linear growth.
In general, the outputs of human activity grow in a non-linear fashion. That is, if you double the number of consumers, then the object they consume will not be twice as much, but will be more than that. This non-linear growth can be expressed as:
Output α (consumer growth)N ; N > 1
Where the symbol α means proportional too. For linear change, N=1. If N >1 the increase in output is non-linear and we will often refer to that as acceleration. We will see this kind of acceleration in the climate change data, when we come to it.
For an initial example, we consider the decadal growth of world steel production shown below. We adopt the period 1980 to 2000 to define a linear baseline for growth (green arrow). Acceleration is then visually seen as later times have real world values that systematically lie above the extrapolated linear trend. In the case of steel, production/consumption started to accelerate primarily due to the emerging global economic power of China, starting around 2003.

For this example, the value of N is arrived at as follows:
- over a span of 56 years steel production has increased by a factor of 4.7
- over this same time population growth has increased by a factor of 2.45.
- 2.45N = 4.7; N ~ 1.75
The meaning of N is that if the population doubles, the associated steel output does not also double but increases by 2 1.75 = 3.6 times more steel. Most any resource usage conforms to this general non-linear dependence between number of consumers (proxy by population growth) and actual usage
of some resource.
For electricity use in the USSA there is rather large scaling over the period 1950 - 2000:
Elecricity usage α (pop growth)3.5
Operationally this means that if your double the population you
need to supply 23.5 = 11 times more electricity, not
just twice as much. Put differently, a doubling of electricity generation requires only about a 20% growth in population. Imagine what kind of world you would live in if all planners assume that all growth is linear! Yet, that is mostly the planning world that you live in all the time the real world
is doing this:
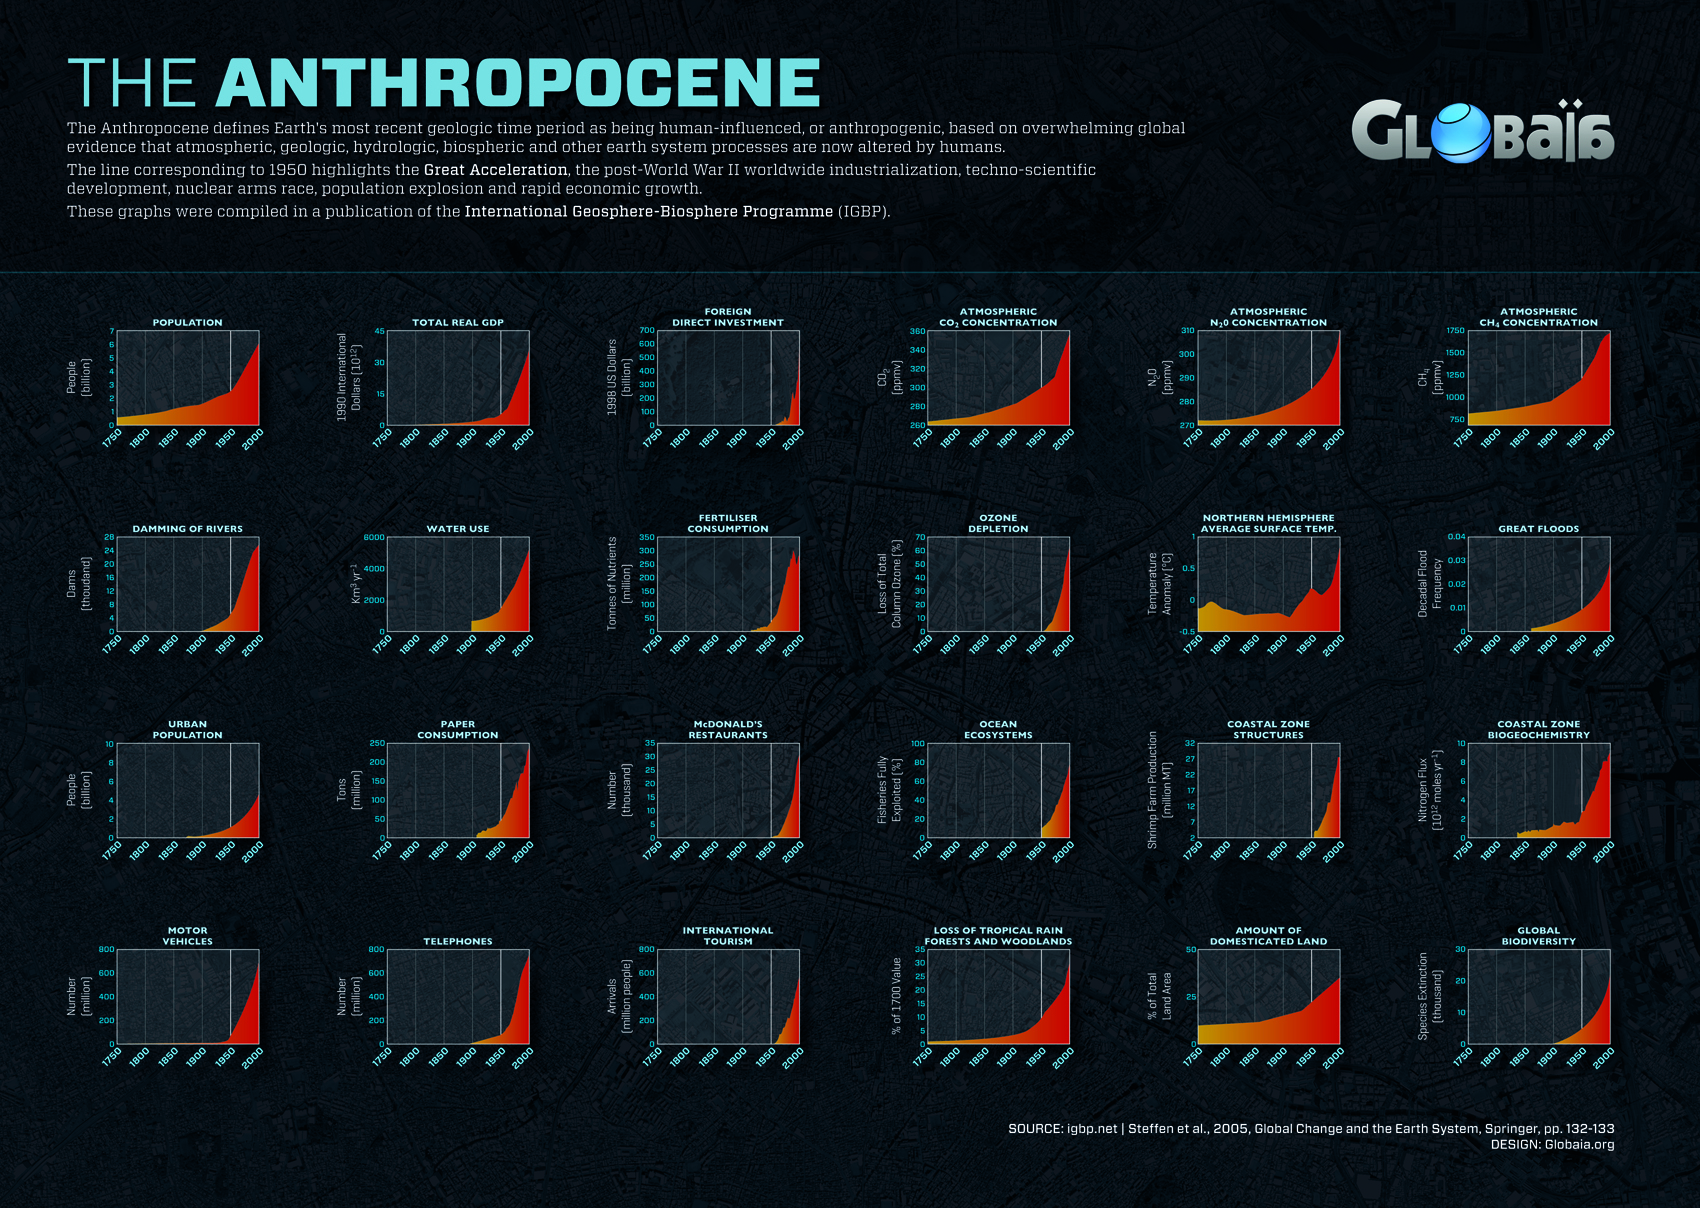
In the introductory document to this class, we discussed how shipping containers are a good proxy for global consumption.
The You tube video below further expands upon this.
The WalMart Express:
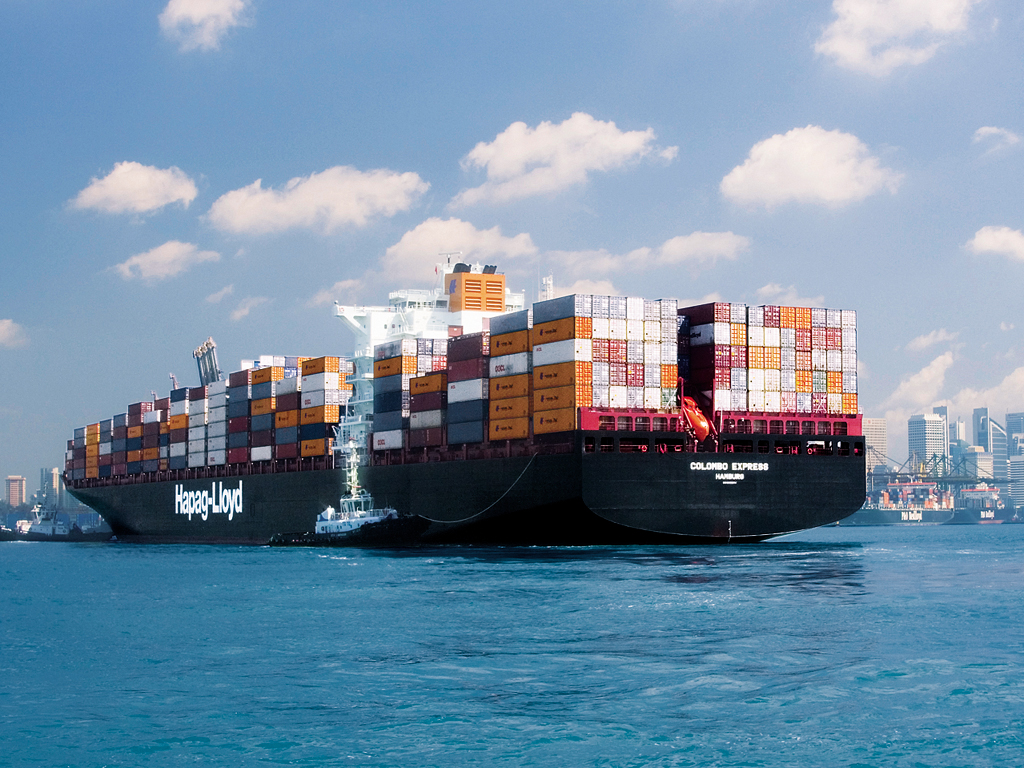
The containers on each WalMart Express are called TEUs (twenty foot equivalent). The figure below shows the non-linear rise in TEU traffic. This is what globalization really looks like and it
is this enormous
factor of 10 Growth in just 25 years! This is the consequence of global consumption and this
is the principle driver of Climate Change, as we discuss later and also presented in the introduction and updated version of this graph.
For the period of 1990-2008 the overall scaling is the following:
- World population grew by 28% (1.28)
- Total container traffic grew by a factor of 6.5
- N ~ 7.5
For that absurdly high value of N if the world doubled its population it would use 27.5 or 180
times more resources. Clearly the Earth is not big enough to satisfy this growth demand which once again directly shows us that we are currently living the the most unsustainable of all times.
<
center>
|