When does Peak Consumption Occur?
How fast will Resource X be depleted? - Seems like a simple question and a question that might be important answer in
a reliable way. Yet, in general, we do bad at this as well.
For example, suppose we have the following situation:
- As of 2013, there are 100 units of Resource X still available to us
- In the year 2013, we will use 1 unit of Resource X.
- as measured over the last 6 years prior to 2013, our use of Resource X grows at
the rate of 5% per year.
Dear Congressperson, when
will resource X run out.
Congressperson says "oh don't worry, Resource X will be around for 100 years because 100/1 (R/r) = 100 - even I can do that math - and I will just ignore that small 5% deal that you claim
exists"
Well, does ignoring that matter or not?
Clearly, Exponential growth, in general, is not understood by
the lay public. If exponential use of a resource is
not accounted for in planning - disaster can happen.
The difference between linear growth and exponential
growth is astonishing. Exponential growth means that some quantity
grows by a fixed percentage rate from one year
to the next.

In this animation, one can clearly see that no matter what the growth
rate is, exponential growth stars out being in a period of slow ( and looks LINEAR during this period
growth and then quickly changes over to rapid growth with
a characteristic doubling time of 70/n (n = annual % growth rate; e.g. 70/5% = 14 years). (yes I know you have seen this before, but redundancy helps to drive home the main point).
Hmm, I wonder if there is a way to find out if ignoring the
growth rate in resource use actually matters. Why yes there is!:
The correct equation for calculating the exponential exhaustion
timescale (Te) of any resource (should be required knowledge for any one
elected to congress):
Te = 1/k * ln (Rk/ro +1) The
derivation of this equation
where k = growth rate
R = total resource available
ro = initial consumption rate
Back to congressperson speak:
"Gee that's a complicated equation I am not sure I understand it
nor how to use it (don't worry there's in app for that) so I
think I will just continue to ignore that. Life is much simpler
when everything is linear and honestly, I don't think the 5%
growth rate is a big deal. So I use 1.05 units next year, I still have about 99 left - what's the big deal"
Well, let's first consider that question in a historical context.
 Let's start out with the curve for US Oil production in the lower 48 States. Note that peak production occurs on a timescale of
1/2 of Te as the production curve is assumed to be symmetric. In the real world, when resources reach peak production, prices tend to
go up which can then serve to lower consumption and extend the exhaustion timescale. Let's start out with the curve for US Oil production in the lower 48 States. Note that peak production occurs on a timescale of
1/2 of Te as the production curve is assumed to be symmetric. In the real world, when resources reach peak production, prices tend to
go up which can then serve to lower consumption and extend the exhaustion timescale.
In 1956, M. King Hubbert published an ignored
paper based on this methodology as applied to US Oil production. In that paper he assumed the following:
- Measured Growth rate of oil production in the US over period of 1945-1955 was 3% (.03)
- Starting period of calculation is 1946
- Hubbert estimates the ratio of R/ro in 1946 to be 120
He then published his 1956 paper which predicted that the lower
48 states would reach peak production in 1971. Of course, no one believed him at all and he was not taken seriously even though
his methodology was secure and he even turned about to be correct (which usually happens when you characterize the problem correctly from the outset)
We can gain further insight on this methodology by using the
following "app"
Excel template
When you first open the spreadsheet you will see the 5% growth
rate scenario that starts with R/r = 100. Please now mail
your congressperson to tell them that you run out of resource X
in 36 years not 100 years. Gee, I guess that 5% thingie does make a difference ....
In the following examples you are to only change the value that
are in cells A2, B2, and C2. If you change any of the others that you have overwritten the formula for that cell and will have to re-download the spreadsheet to continue,
Examples to do in this template:
- Do Hubberts original one with start year = 1946, k =.03 and R = 120. et voila 1971 appears as the Peak Year
- Now you have just posted this result on your blog and you
ignite a flame war as Mr. BigOil says that you are full of shit
and there is twice as much available oil as you think there here is. So, put 240 into the spreadsheet and what do you get for
the peak year? A mere 10 years more (1981). Why is this? Well, its because the peak year depends on the natural logarithm of R/r and not on R/r directly and ln(R/r) is smaller than R/r. This
is simply not understood by congresspersons or BigOilMen or most students and its the reason that all of this is not intuitive (but it is correct).
- Now let's consider the case for "peak oil" or the exhaustion time scale for oil. Remember that in the real world we are at
plateau oil because we are refinery limited. The calculations
you will do below assumes that are not limited by this.
- Make the start year 2010 and R/r = 50 and let k=0.03.
When do we run of oil under that scenario?
- Now make k=0.05 to account of emerging markets. When
do we run out of oil now?
- Now let's mine the crap out of the deep sea sediments
in the Gulf of Mexico to support that 5% growth rate (and have a few Deep Horizon incidents as the cost of doing business) so that
we can triple R/r (to 150). When do we run out now? Is it
really worth the effort to do that?
- What about the case for Natural Gas which is a booming new fuel source as of 2010, how long will the boom last? NG use is growing worldwide at a rate of about 6%. R/r is 70 for this resource. How long
does the boom last?
The basic result of exponential consumption growth is the depletion of the consumed resource faster than anyone believes can happen. Since we are bad a proactive planning, then this will lead to various forms of reactive chaos.
The Exhaustion of Steel:
The most serious material scarcity that the world faces (but again no one believes) is that of steel. Steel is still the main building material for almost all the world's infrastructure. Eventually steel will be replaced by carbon fiber but that is
at least 50 years away.
Steel is basically Iron Ore plus some alloy (zinc, tin, manganese) and among these, manganese is the most widely used alloy.
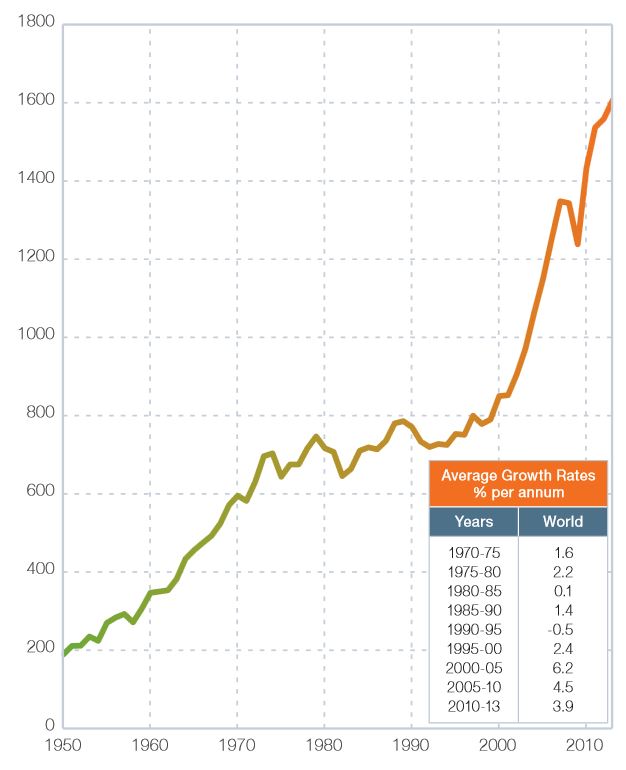
Averaging together a few estimates suggests that in the Year 2012,
R/r for steel was 150. The global rate of usage of iron ore for the making of steel is shown below along with an inset that shows the growth rate in various 5 year periods. Clearly
the growth rate in each period is different (due to market and demand conditions). However, while it once appeared that the
use of steel was leveling off (1980--2000) from an earlier
steep rise, the emergence of China has strongly changed the
steel market and if it weren't for the global economic meltdown of 2009, the rates would be even higher. Currently the world demand for Iron Ore exceeds the available supply.
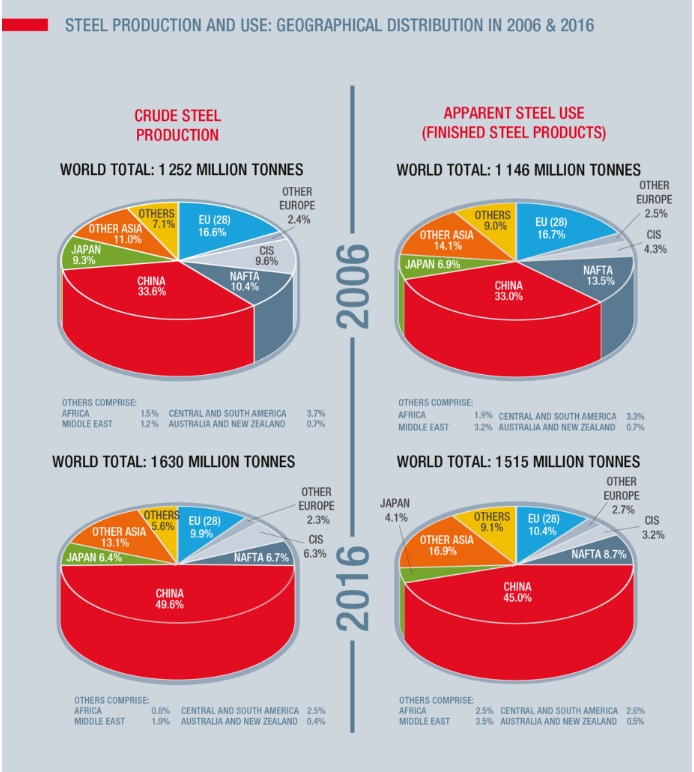
And rise in China over a 10 year period can clearly be seen in this Graphic from the World Steel Association
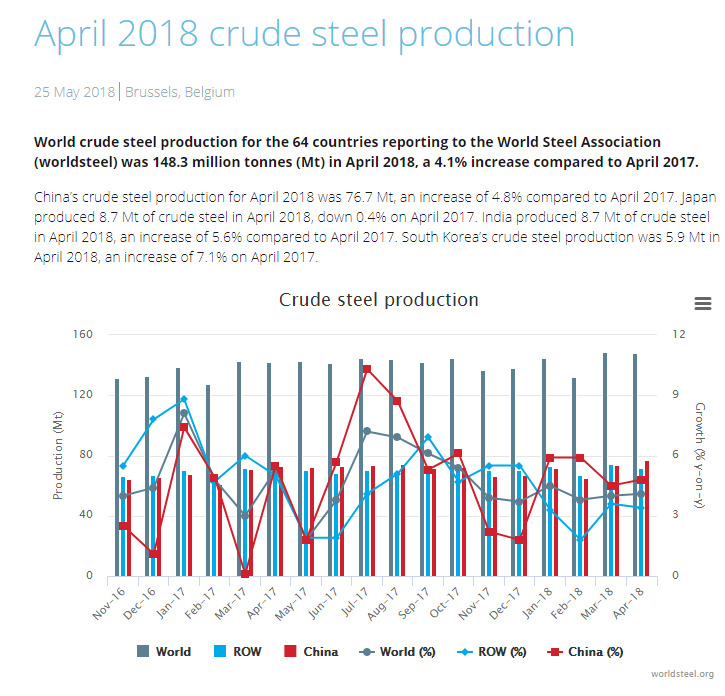
The most recent data (April 2018) is shown below.
So steel exhaustion we can envision three scenarios starting
in 2013 with R/r = 150:
- Maintain current growth rate of 3.9%
- Use 10 year average of 4.7%
- Assume market driven growth rate of 6.2% (e.g. 2000-2005 figure)
The issue of steel production is directly associated with the
reserves of Manganese that are available. This information can be found here: Manganese For the case of manganese use in the production
of steel, R/r is about 40 which is not much left given our production rate.
Clearly manganese based steel is on the verge of running out which has created a strong increase in the price of manganese
in world markets. This is the general market reaction when you
get past peak production. The chart below shows the global
manganese market from 2000 - to 2009 and you can clearly see the
rapid spike in the price of manganese, from 50$ a ton to 300$ in just about one year of time.
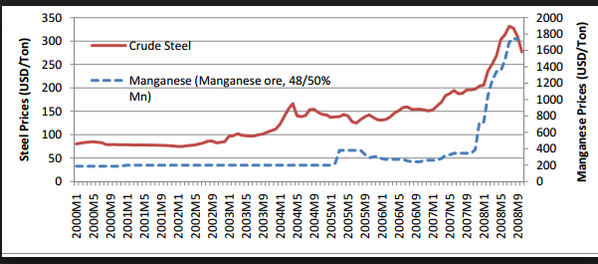
That then
was impacted by the global economic meltdown (history will show
just what a big deal this actually is) as construction slowed down and demand for manganese went down and so did the price.
Maganese Reserves are dwindling while production of steel is increasing. This is what drives
resource scarcity as determined by Hubbert's methodology.
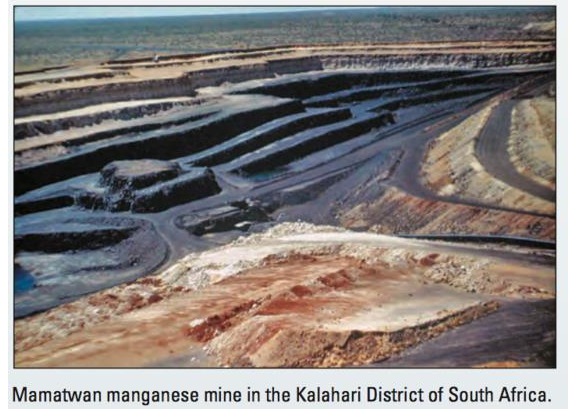
Most manganese production globally is concentrated in four countries: Australia, China, Gabon, and South Africa. 90% of the world's manganese reserves are found in these four countries, along with Brazil and Ukraine. Remarkably, nearly 70% of global manganese reserves are contained in the Kalahari District of South Africa. USA production of manganese stopped in 1980.
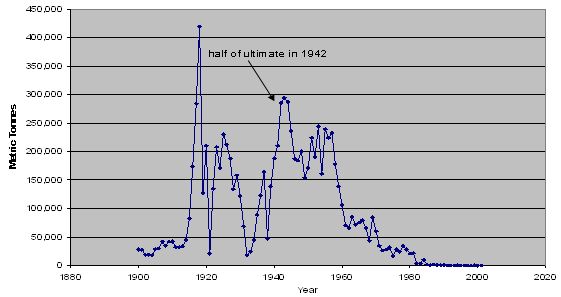
And in that diagram one can clearly see World War I and II in the making of US Steel.
So on the surface, application of Hubbert's methodology strongly suggests that the world is going to
experience peak production on a variety of mineral and other
resources. Various economic corrections will then occur and prices will dramatically rise as
a result of real, global, scarcity. We need to better prepare for this rather than to continually fly blind, apply disney's first law (shown in the intro) and pretending that the Earth is infinite. Resource depletion is an arithmatic and quantitative reality - we will run out of stuff, given our present consumption habits.
|