The Historical Price of Gas


The red line is the important one. It scales the cost of gasoline to real dollars, i.e., adjusted for inflation.

There are several key features encoded in this graph.

  1. Starting around 1950 – the US produced at least 50% of the world's oil supply. So from the period of about 1950 to 1965, the US had world market share and set the price.

  2. Around 1967, the first oil fields were discovered in the Middle East (Bahrain, Saudi Arabia). These were rapidly developed. Because Middle East oil fields are younger and closer to the surface, they are much easier to tap than those in the US. As a result, production in those fields was quickly enabled.

  3. By 1971, Middle East oil began to really make its presence on the market and was offered at a lower price.

  4. This price reduction continues until the first OPEC pricing move in 1974 that caused a dramatic increase in prices. The US panicked and had a knee jerk reaction of "finding more domestic oil." This led to the exploitation of Alaska, which ultimately only really had 20 years of US supply anyway. There is an important lesson here as it applies to our renewed efforts to seek more sources of domestic oil.

  5. Continued instability in the market, driven by OPEC forces, drove the price of gas very high. This ultimately led to the US adopting fuel economy standards. In relative terms, these standards were quite significant as the average fuel economy at that time (mid 1970's) was 13 mpg. By the mid 80's, that had risen to 23-25 mpg (depending on how it was measured). Thus, the US, in 10 years, had achieved about a factor of 2 improvement in fuel economy.

  6. Note the rapid decrease in price of gas after 1980 when the Arab Oil Cartel feel apart. By 1985/86, the price of gas was at an historical all time low. This meant we no longer had to push on fuel economy standards, so we didn't. (Side note: if by 1995 the average fuel economy was 45 mpg, then our dependence on foreign oil would have dropped to about 10%; in 2006 we have so far imported 62% of our total oil.)

  7. Prices fluctuated throughout the 90's because of taxes for the most part.

  8. Prices are now rising rapidly (since about 2003 – see gas buddy to make your own charts. Due to a number of things, but they are all ultimately driven by the simple fact that our current distribution system no longer meets worldwide demand.


    Components of the Price of Gas and their Evolution


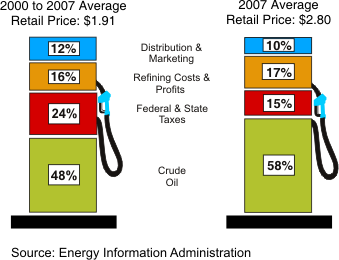
    Clearly the price of crude oil is becoming an increasingly large percentage of the retail price of gasoline.


    World Events Determine Crude Oil Price


    As you can see, the situation has changed with respect to the price of crude oil. Indeed, during the summer of 2006, the price of crude oil rose to an all time high of 61% the price of gasoline.

    This situation now makes the production of gasoline from "other source" commercially viable which explains why we are sacrificing land to grow food on for land to produce fuel. Markets really don't care if people are starving …

    Gas prices are highest on West Coast due to poorest mismatch between demand and local refinery capacity. The State of Washington provides a good snapshot of this. Conditions are similar in Oregon.