So, Who's got the Gas?
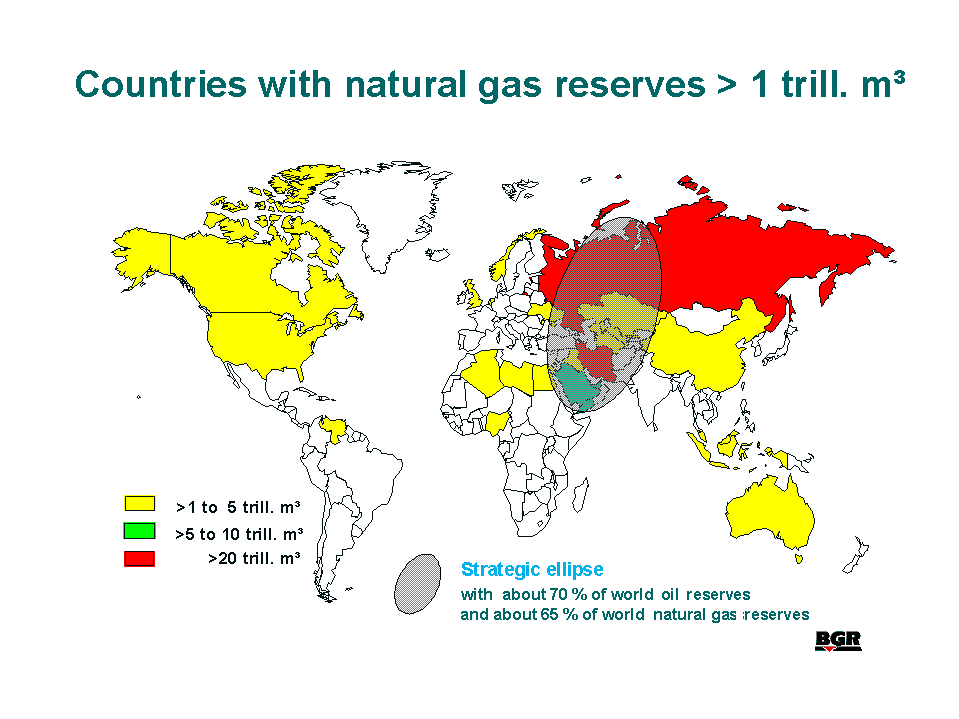
Note the strategic ellipse in the illustration above.
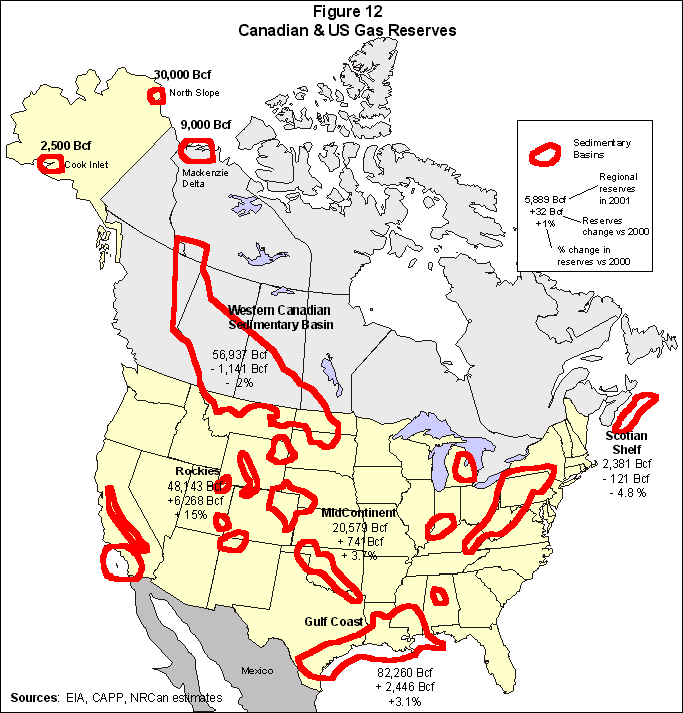
Known North American deposits:
Worldwide Potential:
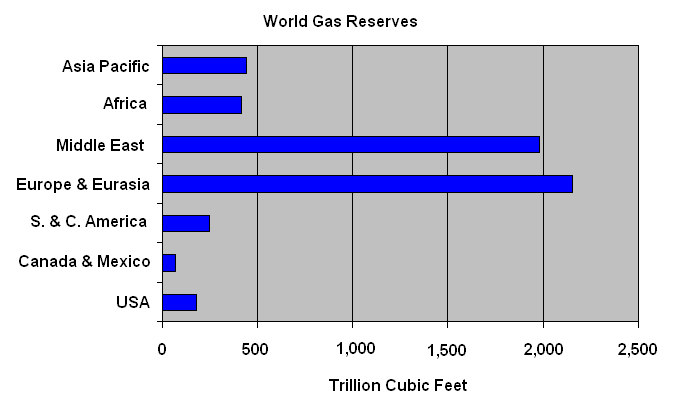
- World natural gas reserves are abundant, estimated at about 5,500 trillion cubic feet (TCF), or 60 times the volume of natural gas used in 2003.
- Much of this gas is considered stranded because it is located in regions distant from consuming markets.
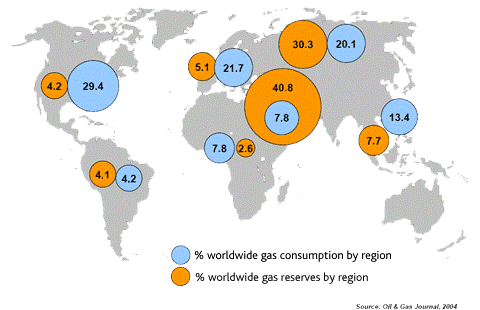
 Therefore, large scale infrastructure projects are needed. Note the dramatic imbalance for the US.
Clearly if LNG is our future energy plan, then large-scale importation is mandatory.
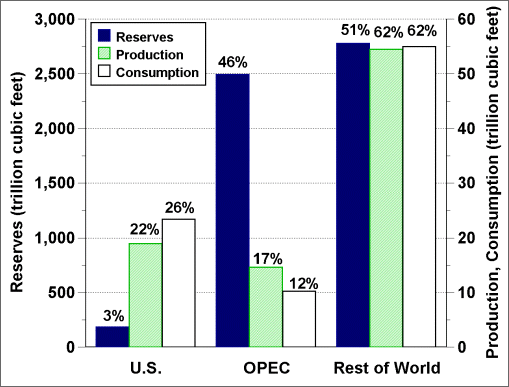
- Russia, Iran, and Qatar combined hold natural gas reserves representing more than 50 percent of the world total. As a result, Russia will invest
heavily in infrastructure to become a major player in the emerging energy
market in India and China as well as the European Union.
In particular, this is scheduled for completion in 2010 and is a
very big deal:
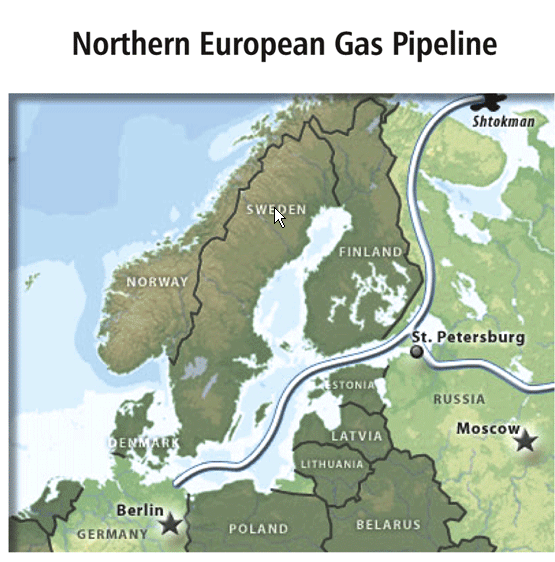
This has major energy policy implications for the EU and certainly will
increase its dependence on Russia and Russian natural gas. There is
also a proposed extension of this pipeline to the UK, but no building
activity on that extension has started (yet).
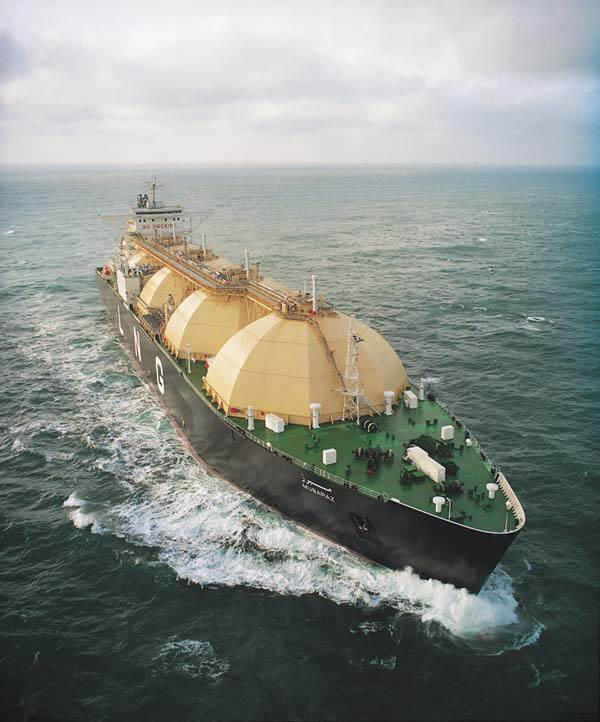
- The 12 countries that currently export LNG have approximately 28% of world natural gas reserves.
 So here is the Russian opportunity.
- Three countries with 33 percent of the world's reserves are currently building their first liquefaction facilities.
 Again, more infrastructure.
- At least seven additional countries, with 19 percent of the world's reserves, are potential LNG exporters.
- Economic crossover point: At what point does it become cheaper to
transport natural gas in liquified form via an ocean tanker compared to
a pipeline?
- Industry analysis suggests this cross over is 2000-3000 kilometers
of on/off shore pipeline. In other words, it's cheaper to ship it across 10,000 km of open ocean than it is through more than 3000 km of pipeline.
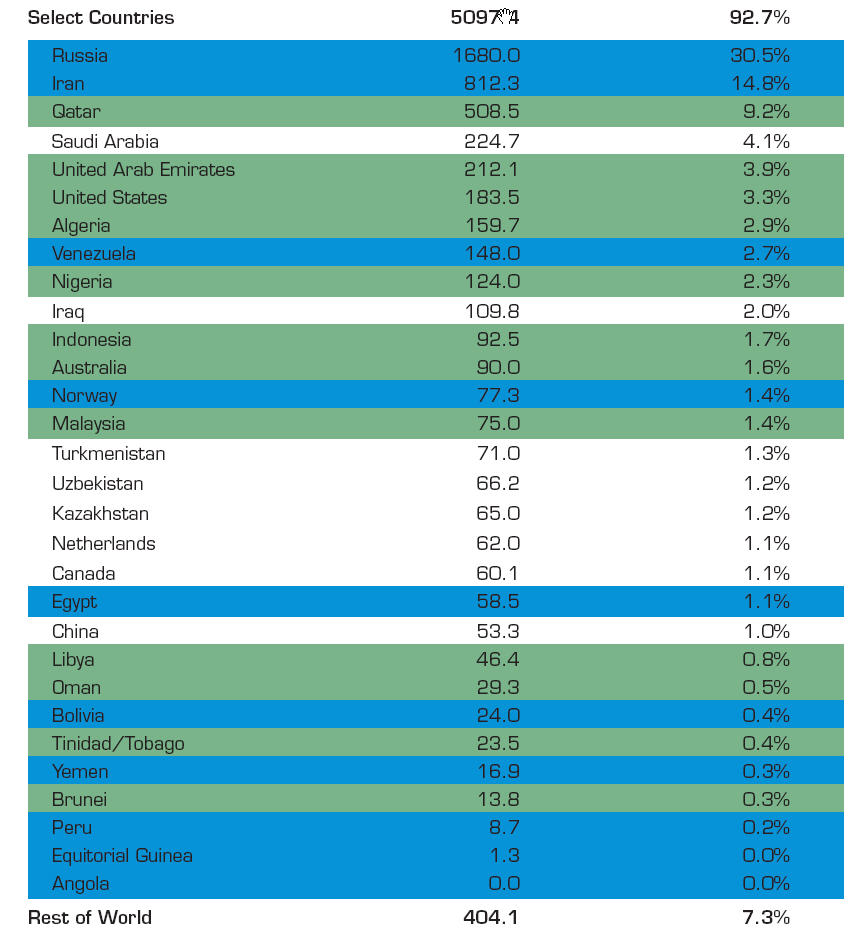
In the table below:
- Green = current exporter of LNG
- Blue = potential exporter
Look at Russia to see the obvious future.
Qatar


In 1993, natural gas was used to generate 9% of the electrical power consumed in the United States. In 2003, that figure was 18%.
Natural gas as electricity (heat water) is only somewhat cleaner than coal-fired electricity.
Emissions:
1135 lbs of CO2 per MWh  1/2 as much
from coal.
0.1 lbs of SO2 per MWh  1% that of coal.
1.7 lbs of NOx per MWh  1/3 that of coal.
Demand is Clearly Rising, Both in the US and Elsewhere:
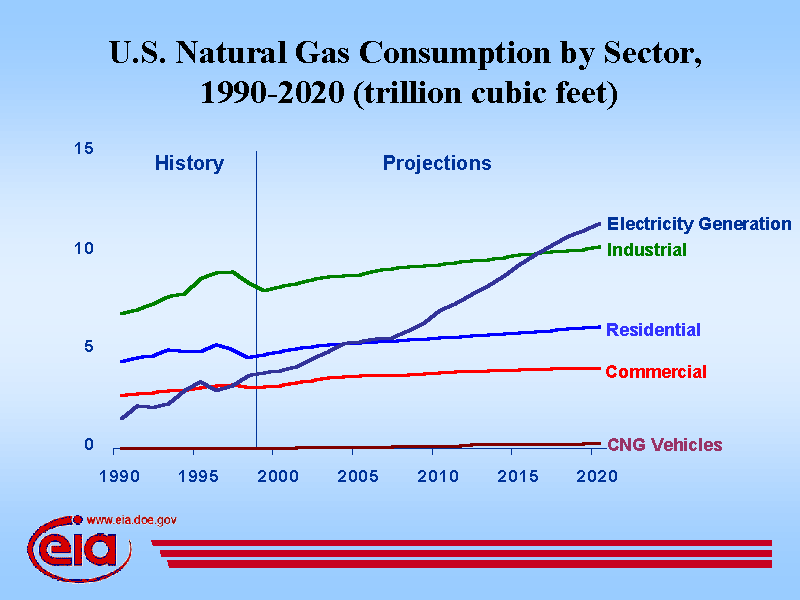
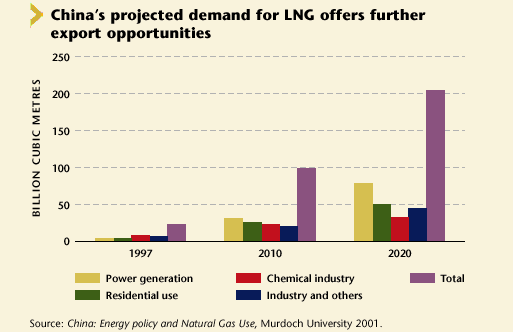
To feed the increasing demand, liquefied natural gas (LNG) terminals are being proposed, to enable imports for the remaining natural gas, now that oil production has started peaking globally.
Natural gas is expected to peak globally around 2020, which could lead to serious global conflict as China and other large and growing economies continue down the path of increased dependence on fossil fuels.
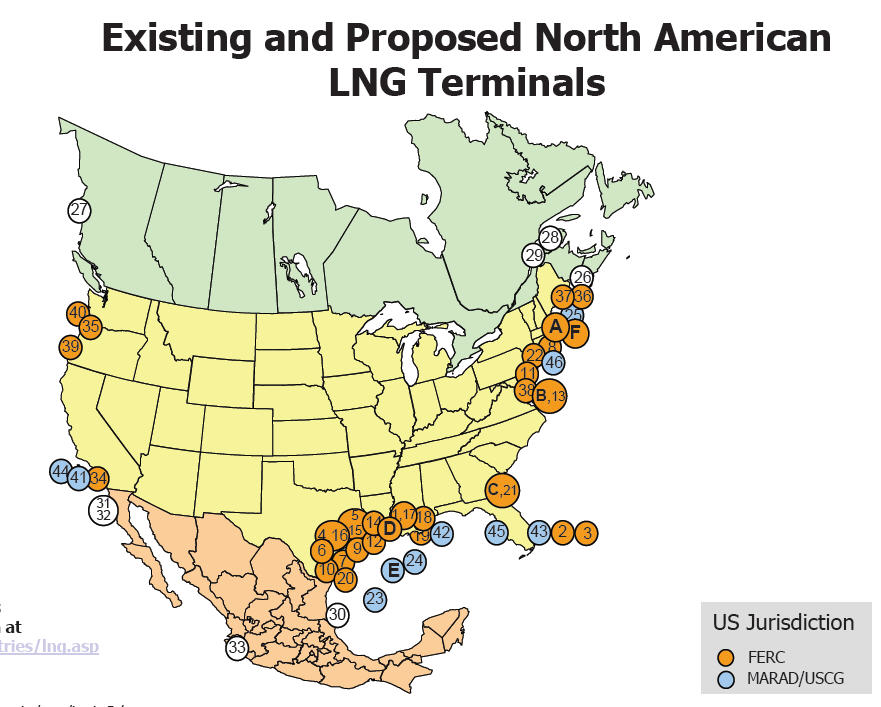
The U.S. has four existing LNG terminals and at least 46 additional
LNG terminals are proposed although some have estimated that only 6-8 are needed to meet demand.
Projections and Figures:
- From 1990 to 2004, natural gas consumption increased by 16%
(or about 1% per year) and is expected to continue to rise at least
at this rate in the near future.
- Natural gas production in the US is currently 19.0–19.5 TCF.
- Current natural gas annual consumption is 21–22 TCF per year (variation
driven by winter time heating season).
- Current NG fired electricity is about 20% of total mix (50% is
coal) but that is expected rise in the near future.
- Net imports from Canada are projected to decline from 3 TCF (2005)
to 2.5 TCF in 2009. (They may rise again, if Canada invests in more production.)
- US reserves as of Jan 2007 stood at 205 TCF (3.3% of world total) or
enough for about 9 years of US consumption.
- Canadian reserves stand at 58 TCF
 not much help there.
- Venezuela stands at 152
 strong potential source of LNG imports.
- Russia stands at 1680 TCF! (But little of that is developed, yet!)
- LNG imports are expected to reach at least 7 TCF by 2025.
- In addition,
this project was approved
in December of 2006.
Growth, Growth, Growth:
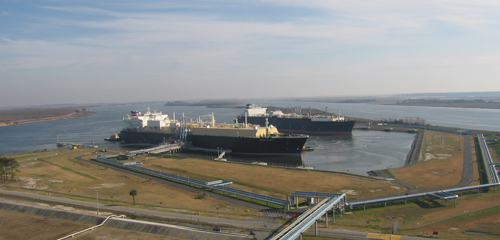
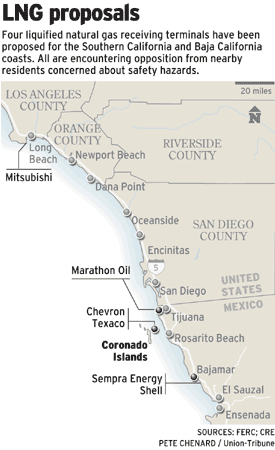
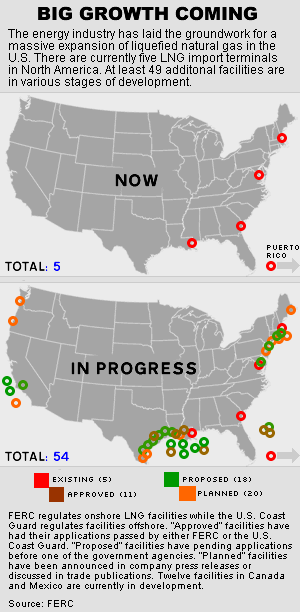
Artist conception of LNG facility in Baja:

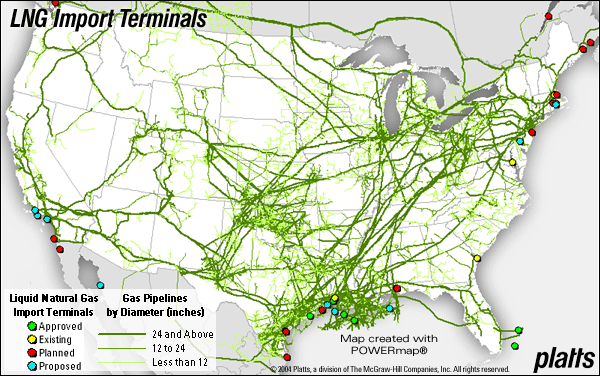
And, of course, one locates future LNG import terminals where there is
good access to the national pipeline.


 Therefore, large scale infrastructure projects are needed. Note the dramatic imbalance for the US.
Clearly if LNG is our future energy plan, then large-scale importation is mandatory.


 So here is the Russian opportunity.
 Again, more infrastructure.


 1/2 as much
from coal.
 1% that of coal.
 1/3 that of coal.


 not much help there.
 strong potential source of LNG imports.


