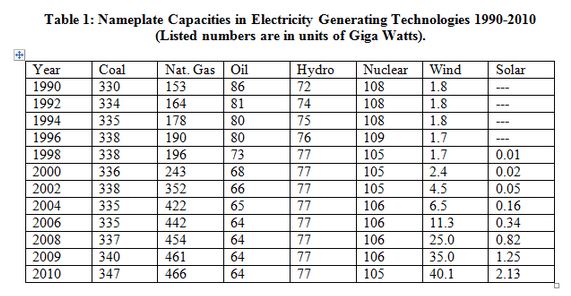
The table below shows the evolution of generating capacity
as a function of technology in the US from 1990-2010. Nameplate capacity represents the maximum possible output from a facility
and is a useful proxy as it represents a direct investment
in facilities. For instance, it costs you the same amount
of money to build a hydroelectric dam independent of whether
any water flows through it. Cost recovery, of course, depends on
the overall throughput of the facility over its lifetime.
This table is meant to show the relatively rapid rise of NG nameplate capacity over the last 20 years where as Coal, Hydro
and Nuclear have all been flat. The total generating capacity
in 2010 is 1.1 Terawatts (1100 Gigawatts). Wind generated electricity is 3.6% of that total (note that by the end of this
year wind capacity in the US will have reached 60 GW nameplate;
a wind farm is about 1/3 efficient for an effective nameplate
capacity of 20 GW).
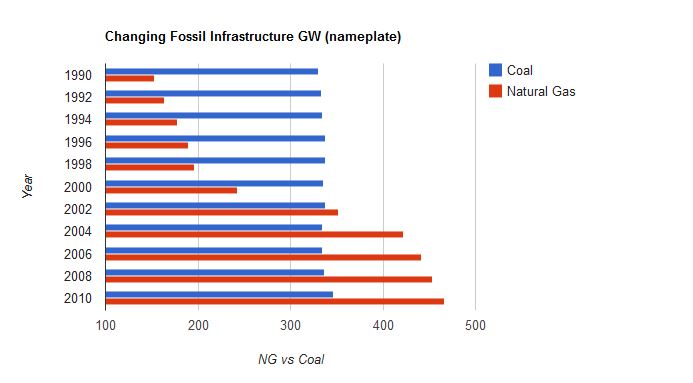
The figure below graphically represents the changing ratio of
Coal to NG capacity for the US
|