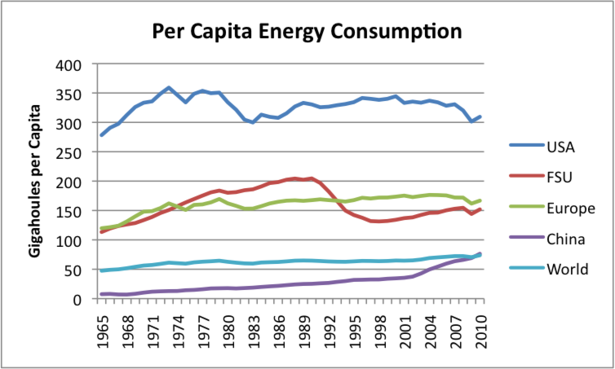
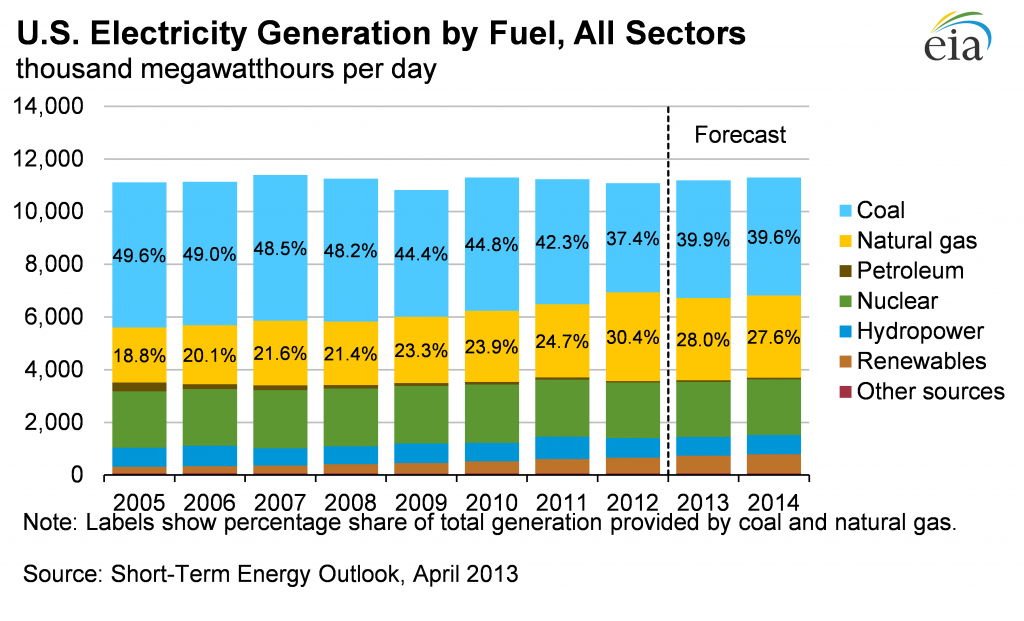
The overall scale of our energy usage is much larger than the common person knows or even understands. This is one of the reasons why its so difficult to move away from fossil fuels as their very high energy content has allowed the US to build a hugely wasteful energy economy and relatively modest cost. But those days are over but because the scale is so large, replacing fossil fuels is really a multi decadel effort. Yes we can, well maybe, for it will take 30-50 years and we really haven't started yet. This situation is clearly summarized in the graphic below were for the last 50 years or so the US per capita energy consumption is at least twice as high as Europe or Russias and roughly 6 times higher than the world. Note however, the rate at which China is growing in this regard. We will revisit this issue later. An important note about Energy. Energy consists of 3 main uses: An important realization of the electricity use by Sector for the US is that only the residential and commercial sectors are growing. Industrialization has been flat, mostly because the US is now outsourcing most of its manufacturing infrastructure (i.e. the US is closing facilities and this hurts the economy even more). 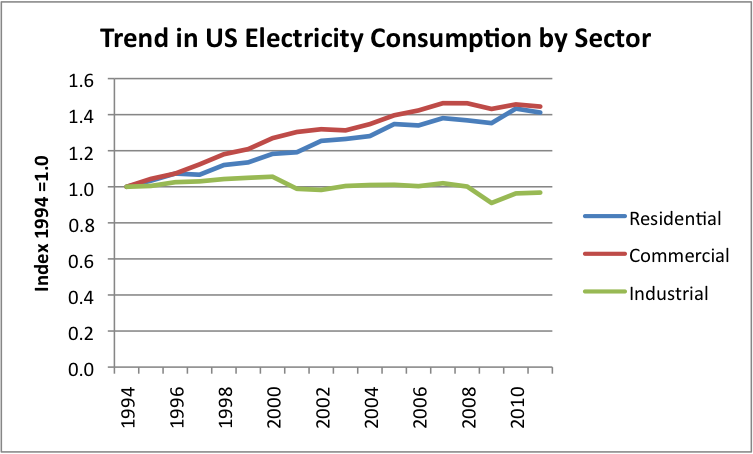 And although some new renewable energy facilities have been built (see Module 5) the US is clearly dominated by fossil fuels and has been for the last 60 years. Roughly speaking 90% of our energy requirements are met by fossil fuels. 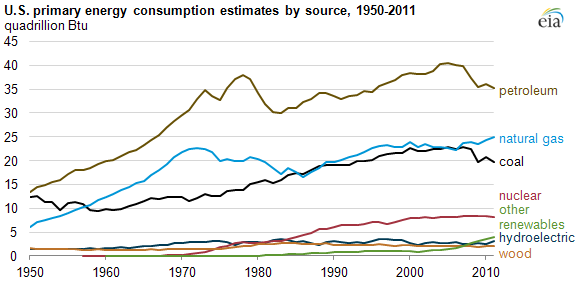 In terms of sources of CO2 emission, electricity generation by Coal and driving with gasoline dominate the US emissions portfolio: 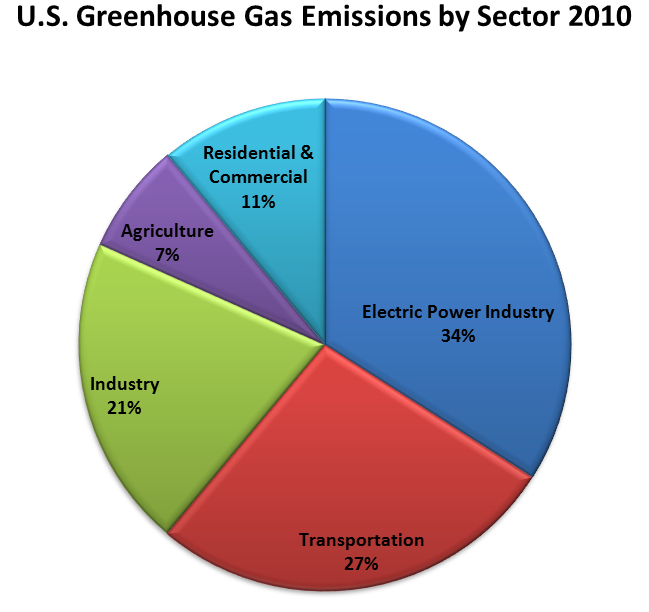
In terms of US crude oil production this peaked at about 9.5 MBD (millions of barrels per day) around 1970 and has since fallen to between 5 and 5.5 MBD, including Alaska. 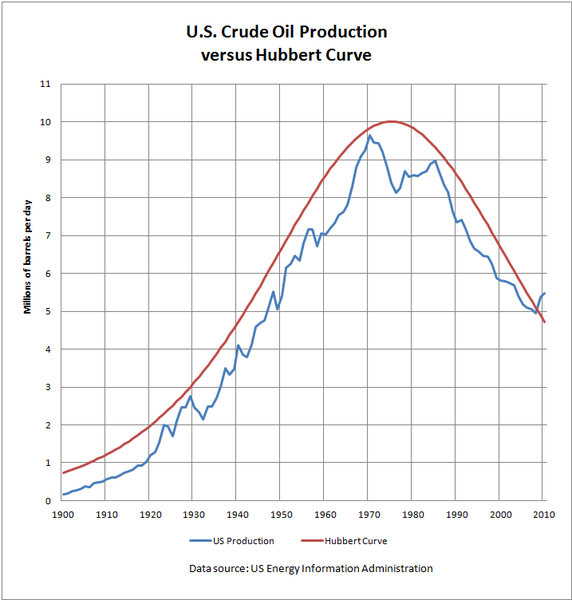
Over this time period the demand for oil has roughly doubled and hence our reliance on imports has steadily increased until somewhat recently. The recent decrease is mostly due to increased average fuel efficiency as we are not driving significantly less than we used to. 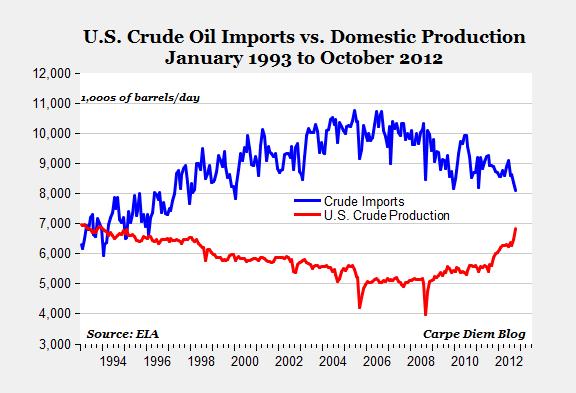
This reduction is likely temporary as most projections show continue reliance on imported oil at least until the year 2025 (when real shortages might begin). 
As can be seen below, one of the essential points in all of this is that US imports essentially doubled over a 20 year time scale. This directly shows the US is not thinking about energy policy and sustainability at all. 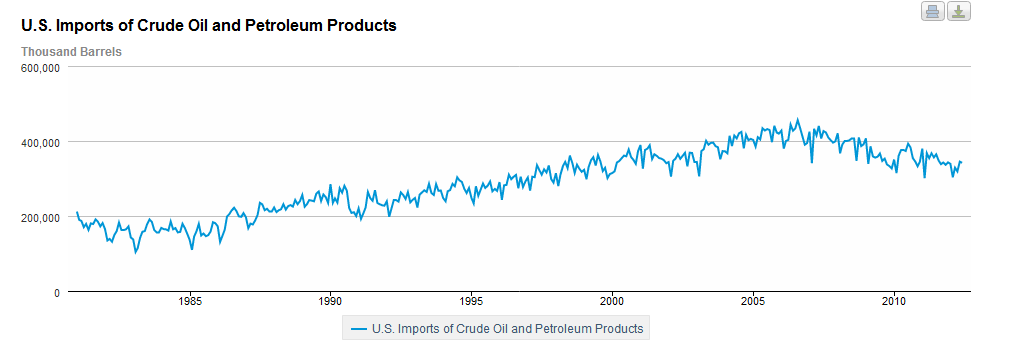
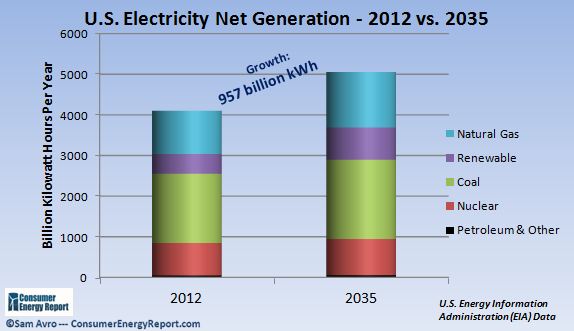
Perhaps this is why we can not seem to actually achieve an "energy independent future" The figure below shows the overall evolution of US electricity generation since 1970 where, primarily though increase use of fossils we have grown our electricity generation infrastructure by 250% in 35 years (that is not what sustainability looks like). 
Future growth is expected, of course, and that demand is expected to be met in three ways: |