Go get the real weekly gas consumption data . The data are weekly consumption listed in units of thousands of barrels (one barrel = 42 gallons).
-
a) What is the average weeky consumption in June 2008?
b) How much less is consumption than one year ago (e.g. June 2007)? Translate this reduction into the price of gas as follows: Say gas is $4.00 per gallon. If consumption is down, say 2%, then that would be equivelent to $3.92 per gallon.
c) When was the most recent year in which June weekly gasoline consumption was similar to current levels?
d) Determine how much higher June 2008 consumption was compared to what it was 10 and 15 years ago.

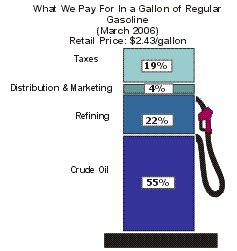
The image to the left shows the components that go into determining the price of gas - price of crude oil, taxes, refining costs, distribution and marketing (the last one represents the profits for the industry).
Starting in the year 2000, research how these components are changing on a yearly basis and determine also if the profit margin (in terms of the percentage) is increasing with time.