Climate change is hard to detect 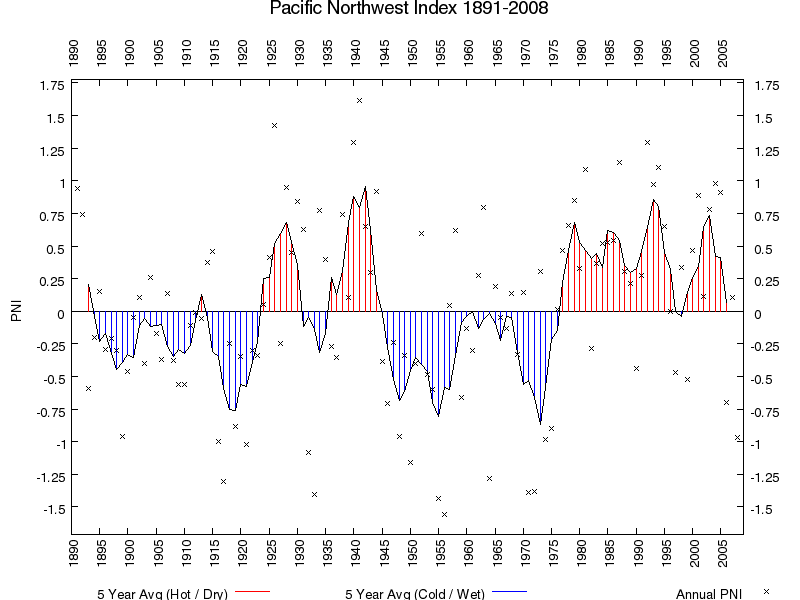
The various peaks and throughs define regions of high and low pressure which look like this, when mapped on to the surface:
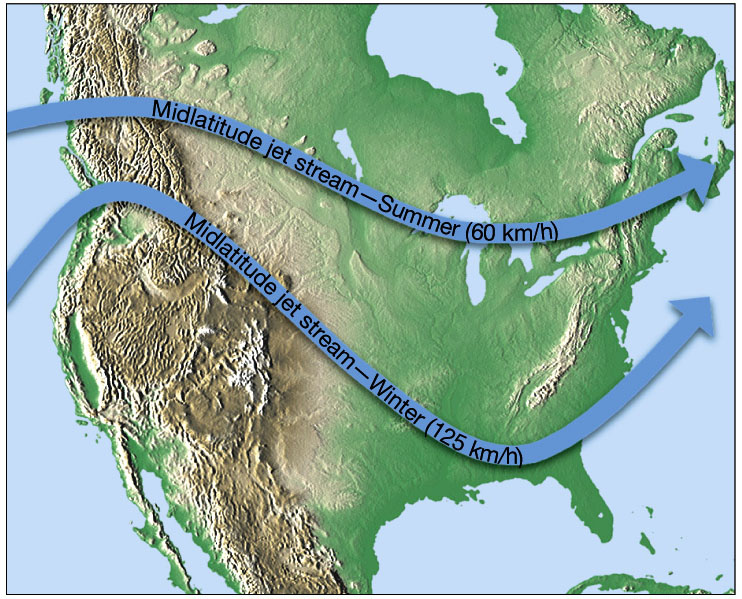
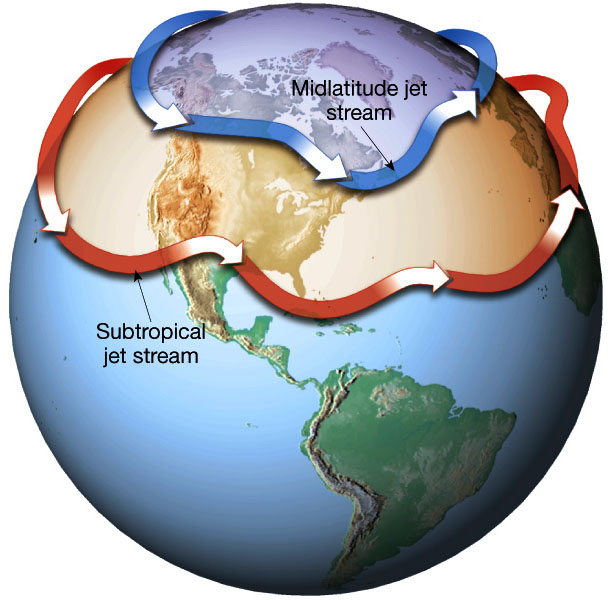
Abnormal regional weather is generally the result of seasonal displacement in "normal" jet stream patterns. In general, the position of the jet stream determines the local weather for a period of 3-5 days.
In the summer, the Pacific Northwest is usually dominated by a very stable, high pressure ridge, resulting in a north wind and dry, sunny conditions.

The effect of the oceans, however, is to change the placement of the jet stream pattern for muliple reasons:
 it is this mechanism that influences jet stream patterns.
Ocean Cycles:
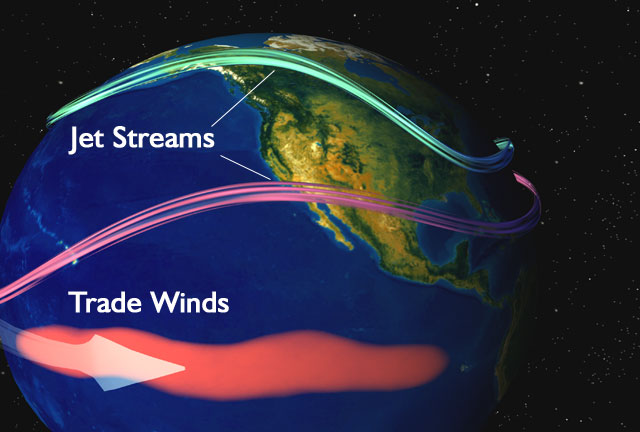
The most well known cycle is El Nino/La Nina. These events are driven by
changes in the trade wind pattern that ultimately determine the equatorial
surface temperature (warmer - El Nino; cooler La Nina) of the oceans.
In an El Nino year, low pressure over northern Australia is replaced by high pressure, whilst air pressure falls over large areas of the central Pacific and along the coast of South America. This change in pressure pattern causes the normal easterly trade winds to be reduced and sometimes reversed. This allows warm equatorial water to flow or "slop" back eastward across the Pacific, and accumulate along the coastlines of Peru and Ecuador. The warm water off the equatorial South American coast cuts off the upwelling of cold deep ocean water. The unusually warm water on the eastern side of the Pacific creates large moisture-laden convection currents in the atmosphere, leading to drastically increased rates of precipitation and flooding. In contrast, the high pressure and cooler waters around Australasia preclude the formation of major rain storms, leading to drought, and sometimes extensive bush fires as the vegetation dries up.
After an El Nino event, weather conditions usually return back to normal. However, in some years the easterly trade winds can become extremely strong and an abnormal accumulation of cold water can occur in the central and eastern Pacific. T his event is called a La Nina. The cold La Nina events sometimes (but not always) follow El Nino events.
El Nino has a pattern of repeatibility on time scales of 3-5 years.
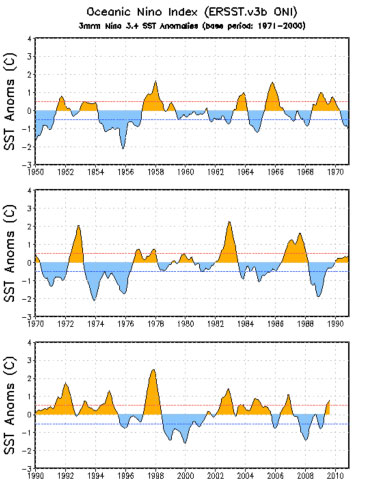
El Nino/La Nina is a subset of the larger Southern Oscillation Index where negative values indicate El Nino and Positive values indicate La Nina. We are currently in a relatively strong El Nino Period:
During La Nina, the
PNW is subject to a trough and therefore cooler
and wetter conditions. The La Nina season of 2007/2008 is similar to
the strong La Nina PNW conditions of 1970-72 these years
produce relatively large snowpacks.
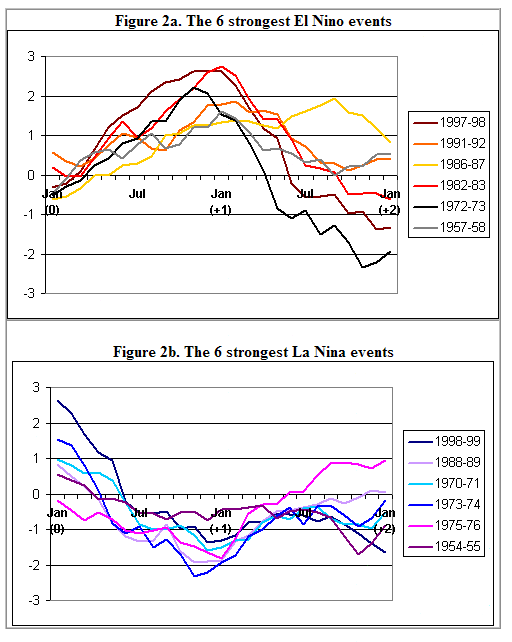
Note the cluster of strong La Nina events in the 1970s which is statistically anamolous (relative to 100 year baseline). During that time there was significant snowpack in the Cascades and quite wet weather in Western Washington. But this period did not represent a "normal climate".
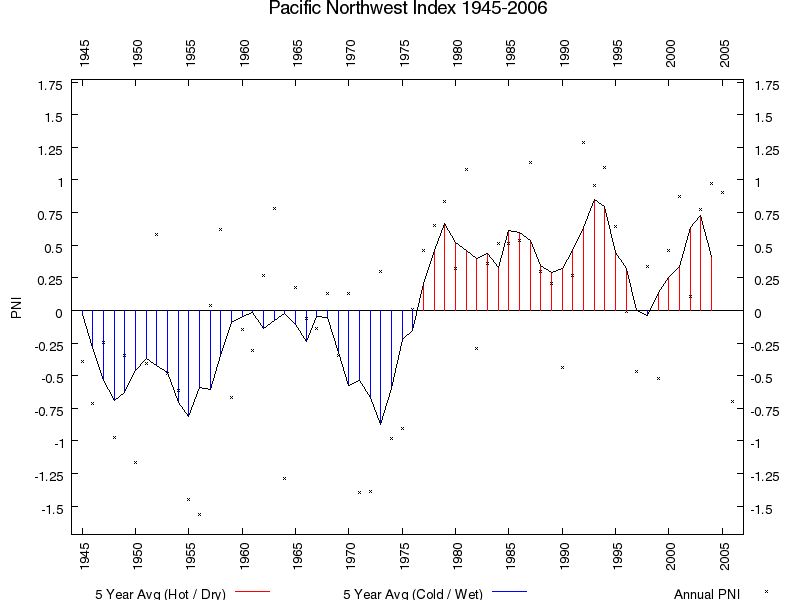
However, the multi-decadel oscillations seen in the Pacific Northwest Index (see above) are not consistent with the El Nino, La Nina timescales.
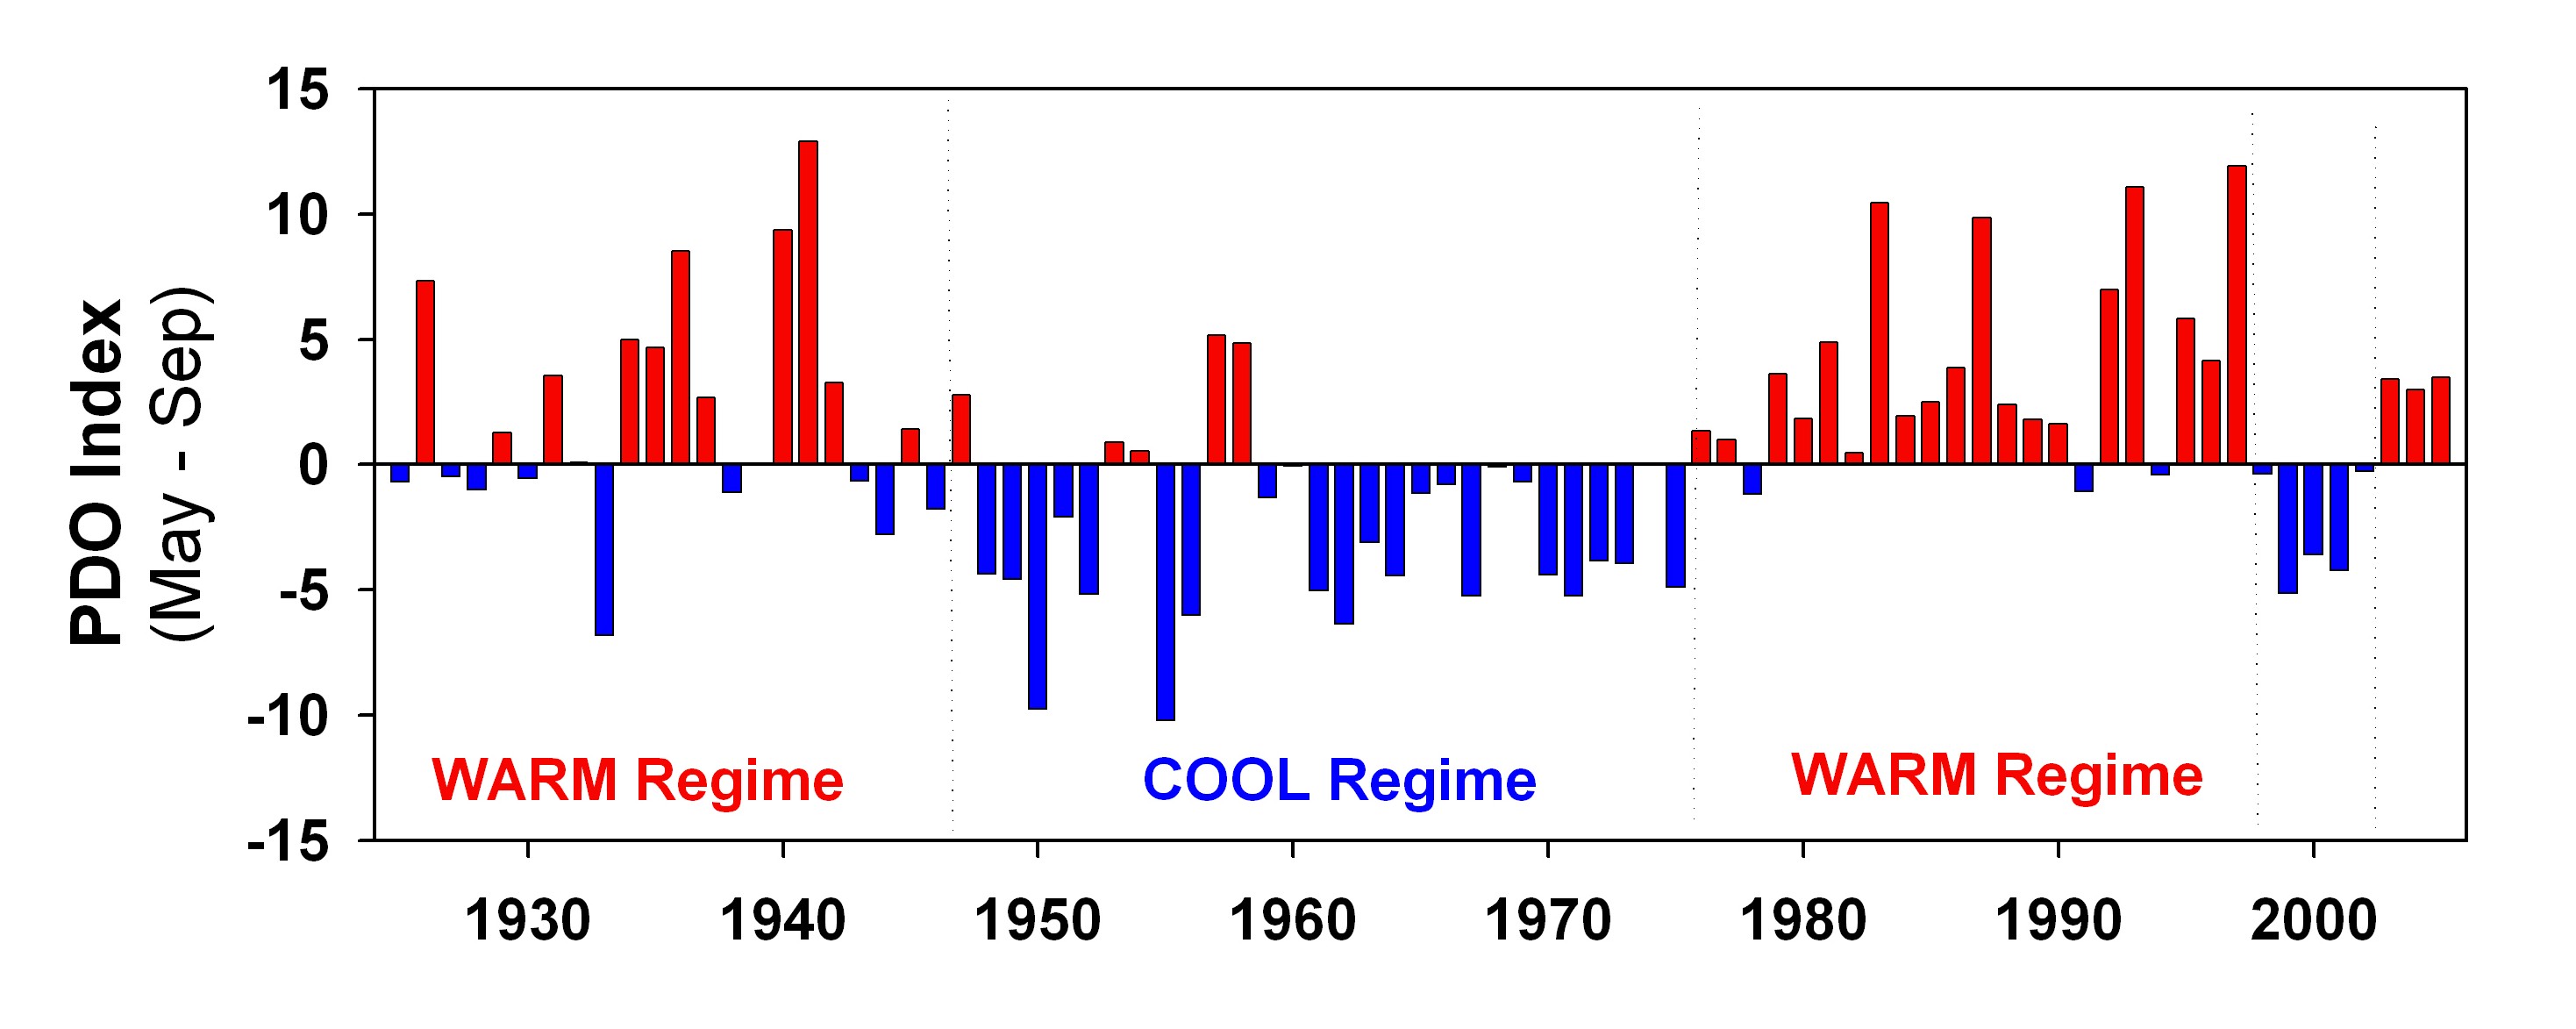
Enter now the Pacific Decadel Oscillation (PDO) which does have the correct timescale:
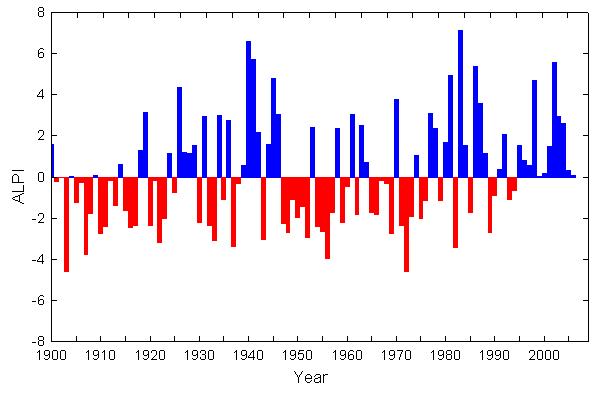
We also now have the Aleutian Pacific Index, which is a measure of the mean baromoteric pressure of the winter time Aleutian Low Pressure system. This basically determines the rainfall amounts in the PNW during winter time. Blue is intense low pressure. These variations are closer to the El Nino timescales than the PDO time scales.
Since these cycles have different timescales, there can be occurences of mutual reinforcement or mutual cancellation. That is the biggest driver on annual PNW snowfall.

Of course, there is also an oscillation in the Atlantic called the Altantic Mean Oscilliation:
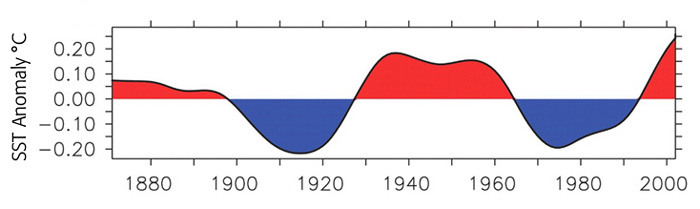
THe PDO + AMO cycles are not in phase:
And these is a major driver of US precipitation Patterns
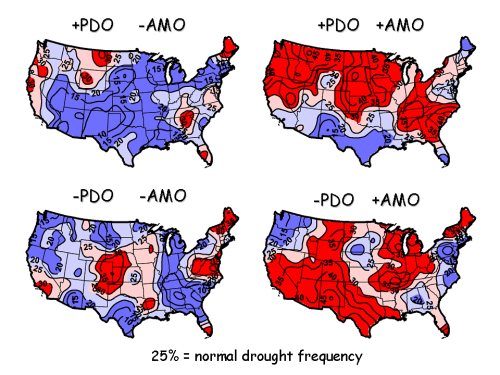
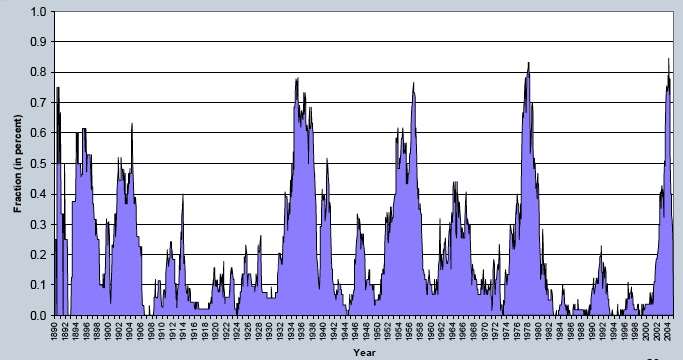
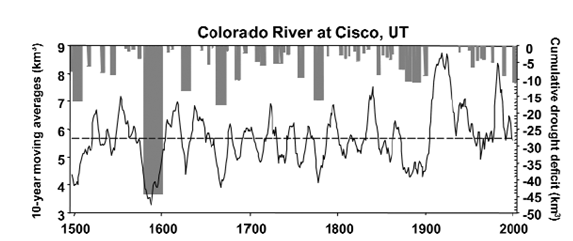
as well as regional ones (Colorado Drought Index)