Principal Uncertainties in Climate Models
Formally, in the IPCC4 report there is a range in predicted temperatures (in the year
2100) of 1.5 to 5 degrees C.
5 degrees (= 9 degrees F) would be relatively catastrophic.
So, what drives this range and how can one estimate what is the most probable
correct model?
Qualitatively one can look at the system like this:
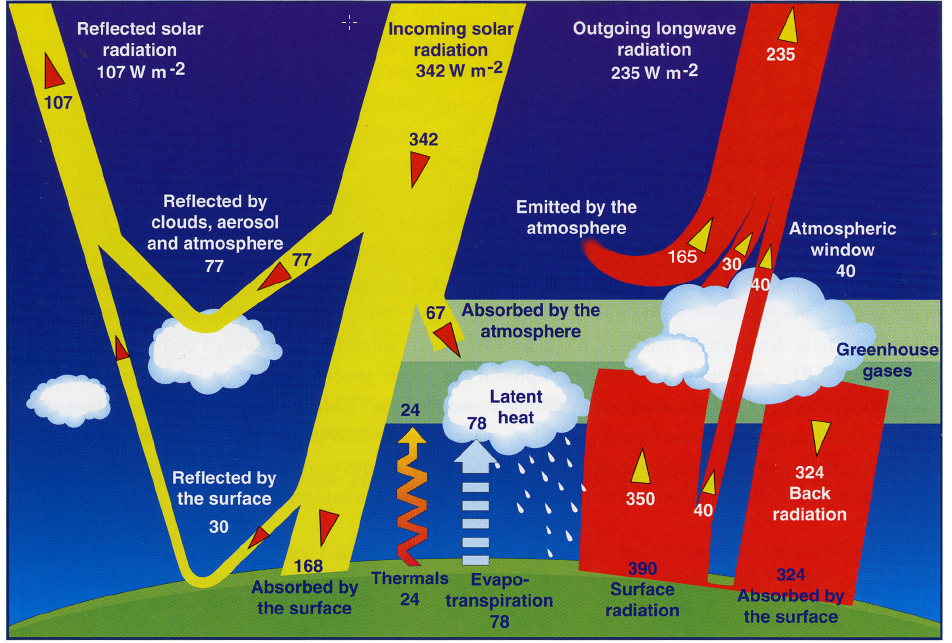
Now these diagrams are always complicated and the lay person has some difficulty with them.
So let's start from the beginning:
- 342 watts per square meters gets through the upper layers of our atmosphere
- of that 107 is directly reflected back into space from clouds and surfaces. The Albedo
of the earth is therefore 107/342 = 31%
- that leaves 235 watts per square meter of solar energy input into the atmosphere and the surface
- 67 of that 235 is absorbed by the atmosphere leaving 168 to reach the surface as short
wavelength light.
- Now remember that finite temperature atmosphere? We get 324 watts per meter of long wavelength
radiation emitted back from the atmospehre to the surface. That means the surface gets a total of
324+168 = 492 watts per square meter. Since the earth is in temperature equilibrium (on average) then
the Earth's surface must emit back those 492 watts per square meter.
- It does so via three channels:
- Direct thermal (rising air) = 24 (not much)
- Release of water vapor contained in plants and soil = 78
- Direct surface radiation = 390
- Now out of that 492 watts per square meter, only 235 can go back into space. So
257 watts goes back into the system.
- of the 390 emitted by the surface 40 goes back into space directly through an
atmospheric absorption free window.
- The other 350 is absorbed by the atmosphere as an additional heating source but 324
comes back to the ground
- The net heating of the atmosphere is then (350-324) = 26 + 24+ 78 from ground sources = 128 =
67 from the sun = 195 watts per square meter. That has to be directly remitted back to space
to keep the atmosphere (on average) in thermal equilibrium
- Add that 195 units to the 40 units clear channel and you get 235 emitted back into space
- Voila, Earth In Balance!
There are two principal activities of humans that modify the pathways
shown in this diagram:
- For the incoming end (yellow) industrial processes (and volcanic ones) produce
sulfate aerosols. This changes the short wavelength scattering properties of the atmosphere
 in principle this could lead to global dimming (there is some evidence of this) as less optical sunlight reaches
the ground and more is reflected by the atmosphere (so the 77 number increases).
in principle this could lead to global dimming (there is some evidence of this) as less optical sunlight reaches
the ground and more is reflected by the atmosphere (so the 77 number increases).
- For the outgoing end (red) fossil fuel combustion together with methane release increases the
radiation absorbed by atmosphere which means mor "Back Radiation" which means less than
235 watts per square meter can escape, and the Earth Warms UP.
In the climate modeling community, these alterations are called climate forcings and they are expressed in physical
Flux units of watts per square meter.
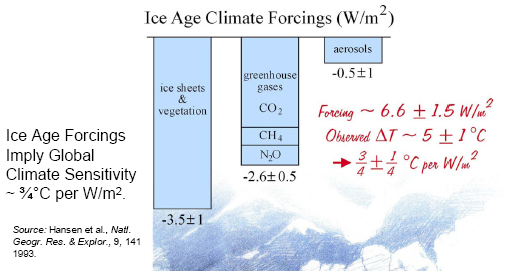
Ice age calibration suggets 0.75 +/- 0.25 Degree C rise with every 1 watt per meter squared increase
of forcing.
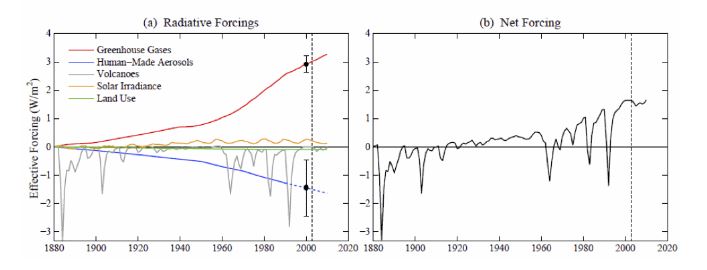
Summary of the relative forcings in the year 2000 compared to the year 1750:
- CO2 is 1.5; The canoncial value associated with a doubling of CO2 (from 280 to 560 ppm)
is 4.0 watts per square meter.
- sum of all the other greenhouse gases shown is (2.54) however, since 2000 the CO2
forcing term has risen faster than the others.
- Black Carbon (basically particulate pollution suspended in the atmosphere or falling out at the poles) produces
another 0.8 watts per square meter
- Sun energy output of the sun has increased slightly. The energy reaching the top of our atmosphere from the sun
is about 1300 watts per square meter and over the last 250 years the sun's output has increased buy about 1/4 of a percent
or 0.3 watts pe square meter.
Summing all this up leads to a total positive forcing of 4.14 watts per square meter.
Which implies 3 +/- 1 degree C increase
To counter that postive forcing
- Aerosols combine to contribute -2.1 watts per square meter (about 1/2 of the positive forcing!)
Oceanic dimethylsulfide (DMS) is the major natural source of sulfur to the atmosphere
- Changing land use (greenspace converted to buildings/parking lots) slighly increases the overall reflectivity
of the earth adding another -0.15 watts per square meter.
- The net balance is then 1.95 watts per square meter.
So in round numbers 2 watts per square meter of net forcing implies 1.5 +/- 0.5 degree C net warming
from 1750 to 2000.
The overall rise of the net forcing is illustrated below. The downward spikes seen since 1960 are the result
of known, large scale volcanic events (El Chicon, Pinatubo) that temporarily greatly increase the sulfate
aerosol content of the atmosphere.
But the most important thing to realize is that the potential positive forcings from greenhouse gas build up
are pretty similar to the estimate negative forcings that occur during little ice ages (due to changing albedo/reflectivity
of the planet, and net loss of greenhouse gases) thus
Humans are potentially altering the climate (disturbing the energy balance) at the same amplitude
as the alteration which causes little ice ages.
1997-98 El Nino