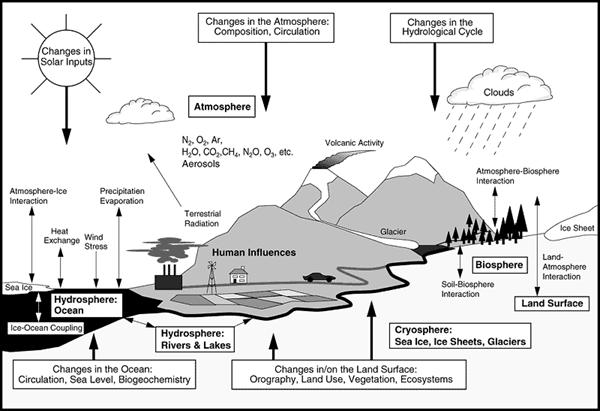
Various Indicators of Climate Range
Global and Regional
Global and Regional
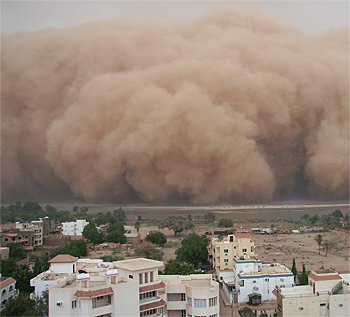
The Big Picture: Chaotic Weather!


- Continued volatility in the weather in the US (2008 is on record
pace for tornadoes) - there is no question that this is occurring.
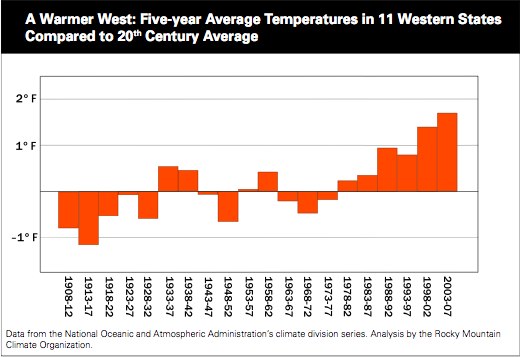
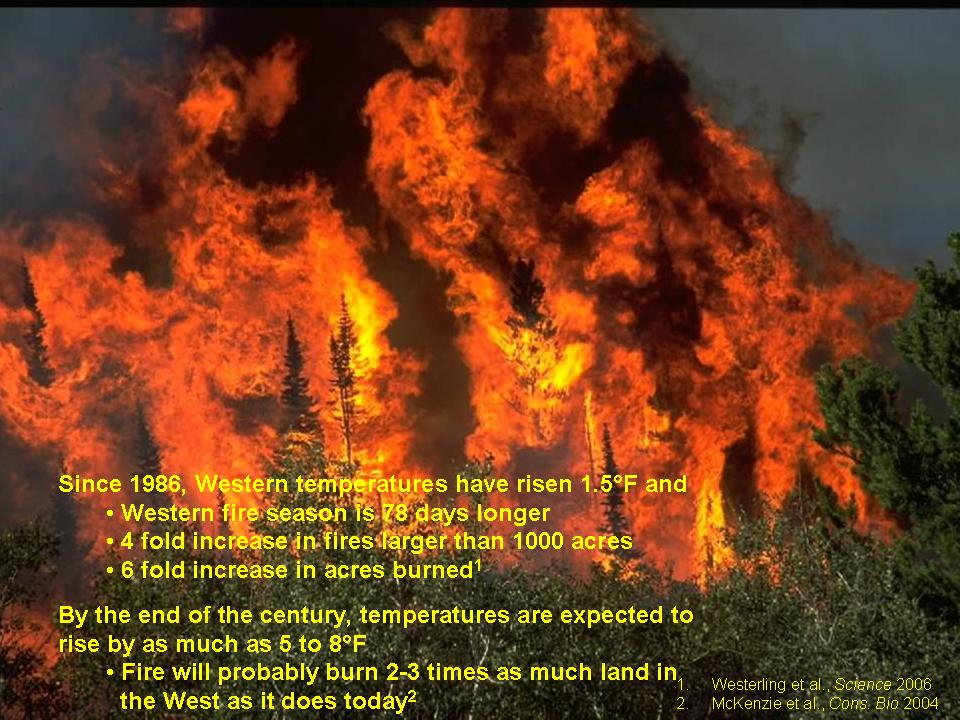
- Vulnerable Ecosystems:
- Alpine meadows in Rockies may disappear
- Barrier Islands (Carolina coast) may disappear
- Southeast forests will experience species shfit or or break up into a mosaic of grasslands, woodlands, and forests.
- Snowpack changes in the American West are critical.
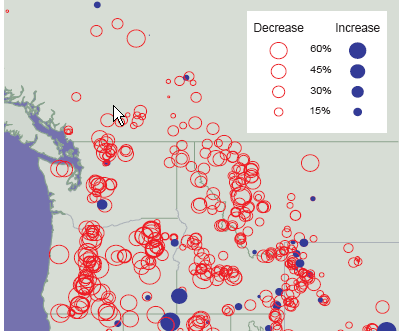
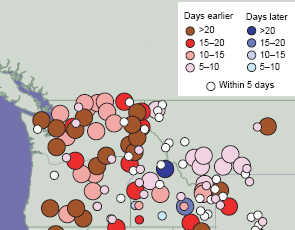
- Near-term increase in forest growth
 Forest productivity is likely
to increase over the next several decades in some areas as trees respond to higher carbon
dioxide levels. Over the longer term, changes in larger-scale processes such as fire,
insects, droughts, and disease will possibly decrease forest productivity.
 In addition, climate change is likely to cause long-term shifts in forest species, such as sugar maples moving north out of the US.
However, since the Earth is a non-linear system, some aspects may not be subject
to slow gradual change. In the lay language, this is referred to as Tipping Points.
The recently released 2008 data on Arctic Ice Loss is cause for real concern as
it marks a significant departure from the linear trend defined by the bulk of
the data and is consistent with the record minimum set in 2007.
The new trajectory suggests Arctic Ice will dissappear in September 2013 - expect
this to be a big boon for the Cruise Ship Industry!

Millions of square km is Y-axis
Data from national snow and ice center
Worse case scenario  The rapid loss of Arctic sea ice will
speed up the disintegration of the
Greenland ice sheet, and a rise in
sea levels by even as much as 5
metres by the turn of this century is
possible.
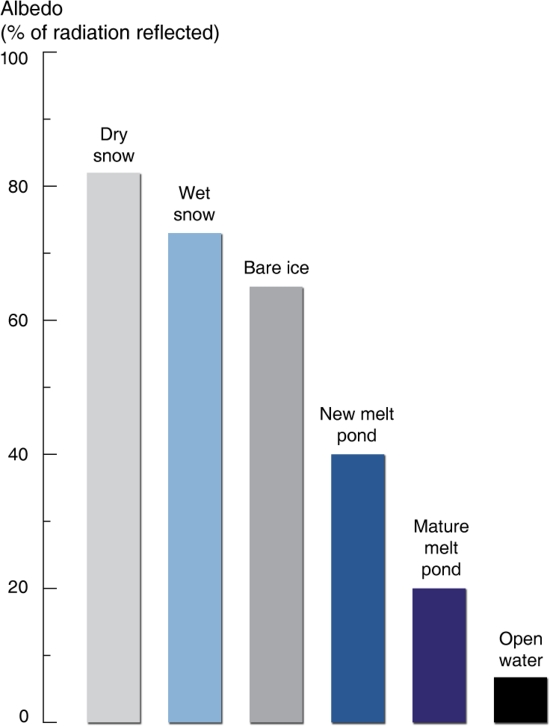
Moreover, Albedo changes (overall reflectivity of the earth) is a fundamental component of the earth's energy balance with respect to incoming solar radiation. Changes in ice composition produce large changes in Albedo:
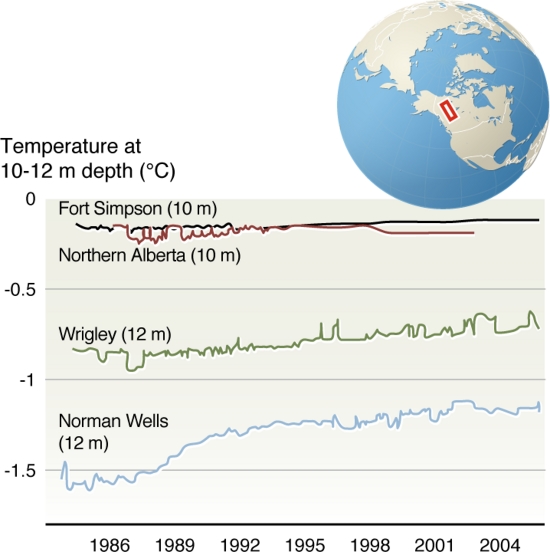
And the permafrost layers are slowly rising in temperature:
While permafrost active layers are quite sensitive to temperature so too are grapes.
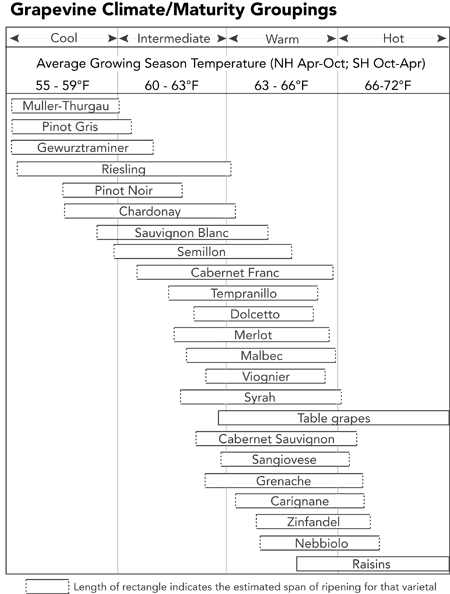
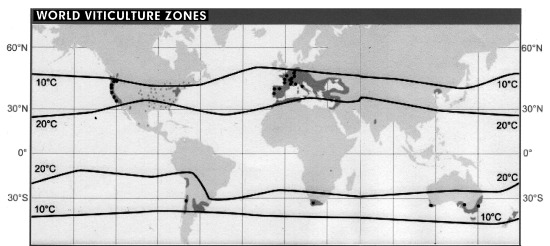
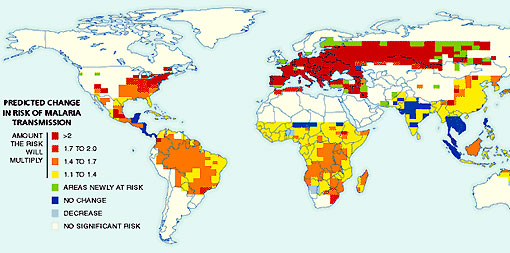
Okay, so your not worried about wine, but maybe you might worry about the 2050 prediction for Malaria risk as we continue along the BAU road:
