Principal Uncertainties in Climate Models

Formally, in the IPCC4 report there is a range in predicted temperatures (in the year
2100) of 1.5 to 5 degrees C.
5 degrees (= 9 degrees F) would be relatively catastrophic.
So, what drives this range and how can one estimate what is the most probable
correct model?
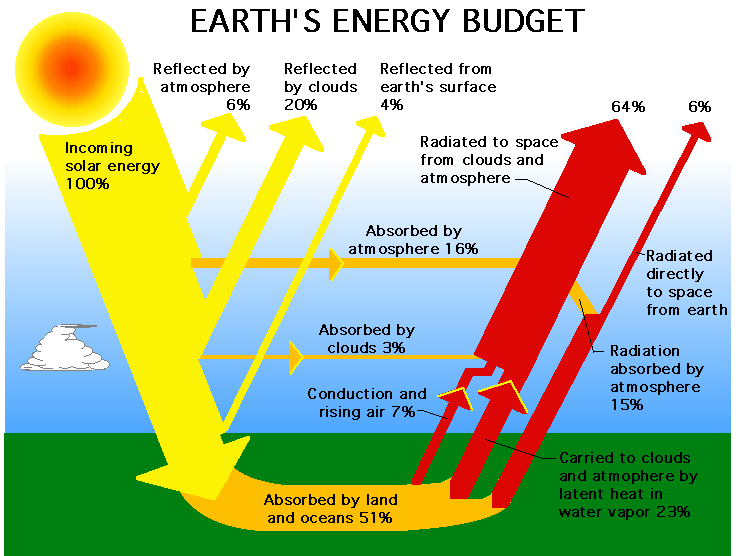
Qualitatively on can look at the system like this:

There are two principal activities of humans that modify the pathways
shown in this diagram:
- For the incoming end (yellow) industrial processes (and volcanic ones) produce
sulfate aerosols. This changes the short wavelength scattering properties of the atmosphere
 in principle this could lead to global dimming (there is some evidence of this) as less optical sunlight reaches
the ground and more is reflected by the atmosphere (so the 6% number increases).
- For the outgoing end (red) fossil fuel combustion together with methane release increases the
radiation absorbed by atmosphere (15%).
In the climate modeling community, these alterations are called climate forcings and they are expressed in physical
Flux units of watts per square meter. For example

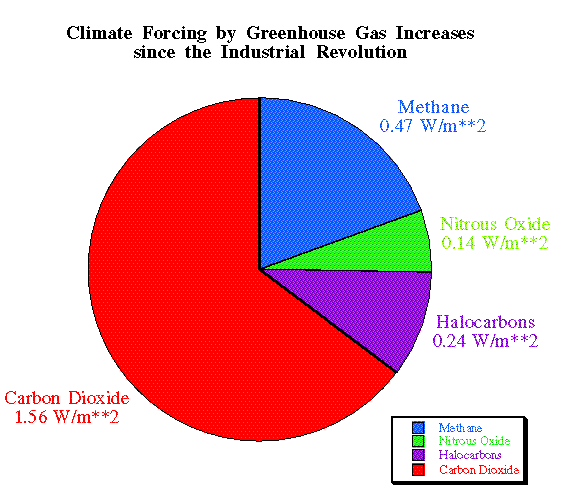
Summarizes what we believe the relative forcings are in the year 2000 relative to the year 1750:
- CO2 is 1.5; The canoncial value associated with a doubling of CO2 (from 280 to 560 ppm)
is 4.0 watts per square meter.
- sum of all the other greenhouse gases shown is (1.54)
 however, since 2000 the CO2
forcing term has risen faster than the others.
- Black Carbon (basically particulate pollution suspended in the atmosphere or falling out at the poles) produces
another 0.8 watts per square meter
- Sun energy output of the sun has increased slightly. The energy reaching the top of our atmosphere from the sun
is about 1300 watts per square meter and over the last 250 years the sun's output has increased buy about 1/4 of a percent
or 0.3 watts pe square meter.
Summing all this up leads to a total positive forcing of 4.14 watts per square meter.
To counter that postive forcing
- Aerosols combine to contribute -2.1 watts per square meter (about 1/2 of the positive forcing!)
- Changing land use (greenspace converted to buildings/parking lots) slighly increases the overall reflectivity
of the earth adding another -0.15 watts per square meter.
- The bet balance is then essentially 1.95 watts per square meter.
This then leads to a tug of war that represents the energy balance in the atmosphere as modified by human
activities:

Where the curves represent the total probability distributions of the positive and negative forcings.


 in principle this could lead to global dimming (there is some evidence of this) as less optical sunlight reaches
the ground and more is reflected by the atmosphere (so the 6% number increases).

 however, since 2000 the CO2
forcing term has risen faster than the others.
