The Two Principle Problems with Energy Management:
 Failure for policy makers to understand the concept of exponential growth. Failure for policy makers to understand the concept of exponential growth.
 Failure for legislature to be formulated and passed to give us a long term
energy strategy that is sensible Failure for legislature to be formulated and passed to give us a long term
energy strategy that is sensible
|
The result of these failures is to create an escalating energy crises as time
continues to run out.
Unfortunately, most people/politicians are either oblivious to this or
believe that some new source of energy will magically appear. Few seem to
understand there are 6.4 billion humans needing energy currently on the planet.
|
Exponential growth drives resource usage for a very simple reason:
Human population increases exponentially:

Accurate trend extrapolation is the most important part of future
planning.
However, failure to assume exponential growth will always lead to
a disaster  so always assume exponential
growth when planning anything! so always assume exponential
growth when planning anything!
Exponential
Growth means that the percentage that something grows on an annual
basis is constant. That leads to the doubling time aspect of exponential
growth.
Doubing Time: 70/n years; n =% growth rate
Its important to recognize that even in the slow growth period,
the use of the resource is exponential. If you fail to realize
that, you will run out of the resource pretty fast.
Guassian Depletion Curve:
Whenever something grows exponentially against a finite resource, there
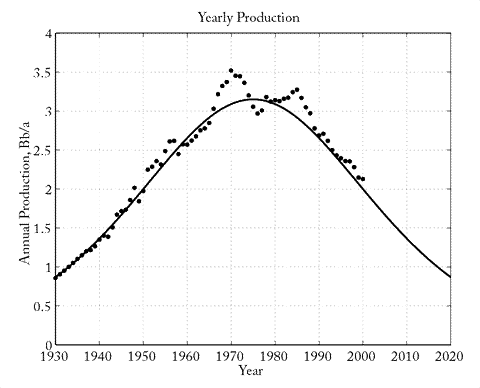
is a characteristic production curve that results. In Oil Depletion,
this is known as the Hubbert Curve.
So in 1956 you make this statement "The US is rapidly running out of production capacity" but no one believes you. What do you know, that they don't?

Hubbert
was able to accurately estimate when North American would have its
peak production (e.g. the peak in the curve above) for the
following reasons:
- He assumed that the intrinstic production curve was bell
shaped. He arrived at this assumption by examining the production
curve of individual oil wells ,which was bell shaped. He assumed
that integrated production would show the same functional behavior.
- He made an estimate of the total oil reserves available in the
US. We will call this R. The total area under the bell curve is
R.
- Empirical data from 1946-1955 firmly showed that the growth rate
of oil consumption was around 3%.
Therefore, if you know the total amount of the reserve, R, you can then
know what fraction of R was used up during the 1946-1955 period.
Only one unique bell curve can simultaneously give you a total area
of R and the correct fractional amount of R used up during this
10 year period.
Now using calculus its fairly simple to derive the depletion timescale of
an exponentially increasing resource usage rate. That timescale is the following:
Te = 1/k * ln (Rk/ro +1)
where k = exponential growth rate (in units of percentage i.e. 3% = 0.03)
R = total resource available
ro = initial consumption rate
As we will see empirically, the term 1/k is far more important than the other
term because the other term grows logarithmically and that growth is very slow.
The basic problem is that we substitute Disney's First
Law for this arithmatic reality of resource depletion.
Some examples to do in Excel. Calculate resource depletion time
scales for various values of k.
Let's start out with the Hubbard Curve. Note that peak production occurs on a timescale of
1/2 of Te as the production curve is assumed to be symmetric.
- Measured Growth rate of oil production in the US over period of 1945-1955 was 3% (.03)
- Starting period of calculation is 1946
- Hubbard estimates the ratio of R/ro in 1946 to be 120
- From this, what do you find as the year of peak production?
Other Examples:
| 

 Failure for policy makers to understand the concept of exponential growth.