The Price of Gas:

There are several key features encoded in the above graphs

  1. Starting around 1950 - the US produced at least 50% of the world's oil supply. So from the period of about 1950 to 1965 the US had world market share and set the price.

  2. Around 1967 the first oil fields were discovered in the Middle East (Bahrain, Saudi Arabia) and these were rapidly developed. Because Middle East oil fields are younger and closer to the surface, they are much easier to tap than those in the US. As a result, production in those fields was quickly enabled.

  3. By 1971, Middle East oil began to really make its presence on the market and was offered at a lower price.

  4. This price reduction continues until the first OPEC pricing move in 1974 which caused a dramatic increase in prices. The US paniced and had a knee jerk reaction of "finding more domestic oil". This lead to the exploitation of Alaska, which ultimately only really had 20 years of US supply anyway.

  5. Continued instablity in the market, driven by OPEC forces, drove the price of gas very high and this ultimately lead to the US adopting fuel economy standards.

  6. Note the rapid decrease in price of gas after 1980 when the Arab Oil Cartel fell apart. By 1985/86 the price of gas was at a historical all time low (relative to the previous period)

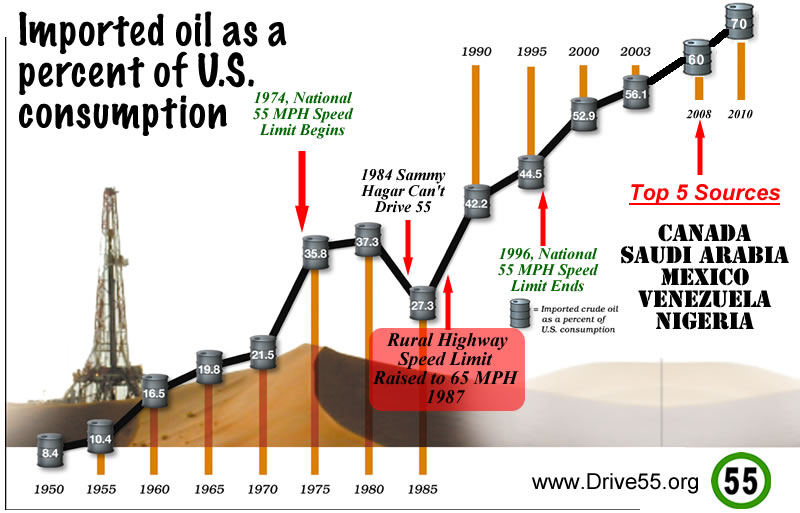
    This meant we no longer had to push on fuel economy standards so we didn't (side note: if by 1995 the average fuel economy was 45 mpg then our dependence on foreign oil would have dropped to about 10%; in 2010 we will import 70% of of our total oil)

    The Above WaveForm is Beyond Stupid

  7. Prices fluctuated in throughout the 90's because of taxes for the most part but were largely stable.

  8. Since about 2003, prices started to steadily rise from about 1.50 a gallon to eventually $4.50 a gallon in June 2008. Afte the economic collapse it looks like prices have stablized at around $3.00 per gallon or what they were prior to the bubble collapse.

  9. Throughout this whole period gas has been relatively cheap as defined by percentage of per capita disposable income (i.e. Beer Money)

  10. Components of Gas Prices - Example

    As a baseline, one barrel of crude oil before refining contains 42 gallons. Therefore, if the price of crude oil, is say, 42$ per barrel - the baseline price for gasoline would be $1 per gallon. At the current cost ($75) the baseline price is 75/42 $ per gallon or about $1.78.

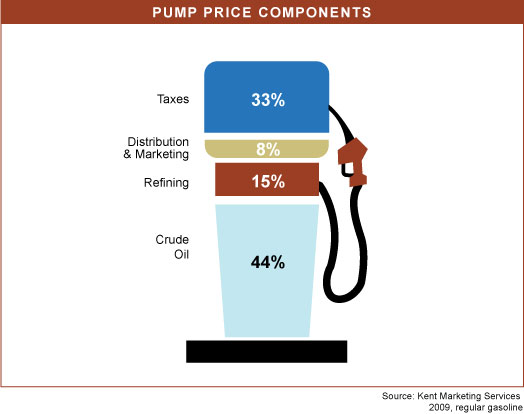
    Out of the 42 gallons of crude oil, somewhere between 19 and 21 gallons of gasoline can be produced.

    The actual profit margin for gas is low but the high volume means that large revenue is generated.

    1. after the processing credit card overhead, a typical gas station owner makes about 5 cents per gallon

    2. A typical sales volume is about 60,000 gallons per month

    3. So that means $3000 a month profit.