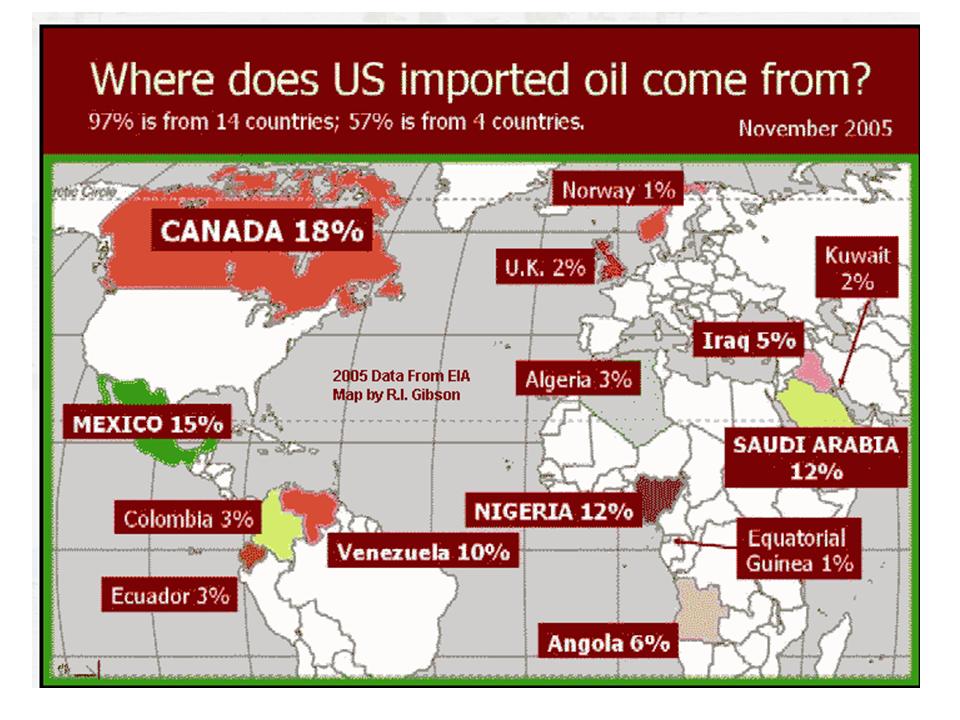
Sources of US Oil
November 2005 snapshot

There has been some small changes since then. The most recent import data comes from Summer 09
Summary of that data
- Canada has increased to 25.2%
- Mexico has decreased to 11.8% (Mexico is running out)
- Saudi Arabia has increased to 13.6% (there is a lot of monthly fluctuation here)
- Nigeria has decreased to 10.2% (big fluctuations there due to political instability)
- Venezuala is at 10.3% (also monthly flucuations)
- Angola has declined to 3.8%
- Iraq has remained at the 5% level (4.3%)
- Kuwait has incrased to 3%
- Columbia remains at 3%
- Ecuador and Algeria are disappearing, now down to 1.5%
- Russia is a new player at 3%
- Brazil is a new player at 4.4%
- European imports (UK/Norway) have declined to zero.
How big is 1%?
- US gasoline consumption is 400 million gallons per day.
- 60% of that comes from imports = 240 million gallons per day.
- 1% of that is 2.4 million gallons a day
- That's equivalent to about 600,000 cars worth per day.
- So 1% matters!