Upload your homework document here
This assignment allows you to work in various techniques that will help analyze clustering in your data. Again it will be structured in various steps, some of which will be brute force.
Steps:
- Download the file
- Walmart Stores this contains the lat and long of Walmart stores - something you have always wanted to know.
- Starting with some basics:
- a) Report the number of lines in the file and how you did this (yes I know it can be done on 1 line with a shell command ...).
- b) Make a subset of all stores that are located in the 48 states (some on that list are likely located else where in north america). Report on how
many stores there are
- c) Determine the density of Wal Mart stores in California compared to Georgia. Do this as a function of a) square miles and b) population. Report those results and include the code to show how you identifed stores in these states
- Clustering first pass
- a) Here we will simply start with a rectangular area which goes in latitude from 38.9 (south) to 41.8 (North) and -86.4 (West) to (-81.9) East. Produce a file for all events within those boundaries. Submit a location plot of those events
- b) Write a brief comment on what you eye-brain perceives as a clustering pattern in that event data
- c) Now measure event density (number of stores per square km) in box sizes of 1,2,4,8 and 16 square km. for each box size, submit the histogram of densities that you measured and comment on any trends that you notice
- d) Determine the average density of stores within the region (we will call this the background density). For the 8 km box, submit a heat map representation that shows the amount of over and under density (compared to the background density) that exists on that scale
- e) Repeat the above exercise but use a cricle of radius 25 km
- f) Determine by any means you want now (trial and error is fine) what the characteristic void size (circular shape) might be in this distribution. Submit your plot with those voids depicted.
- Clustering second pass
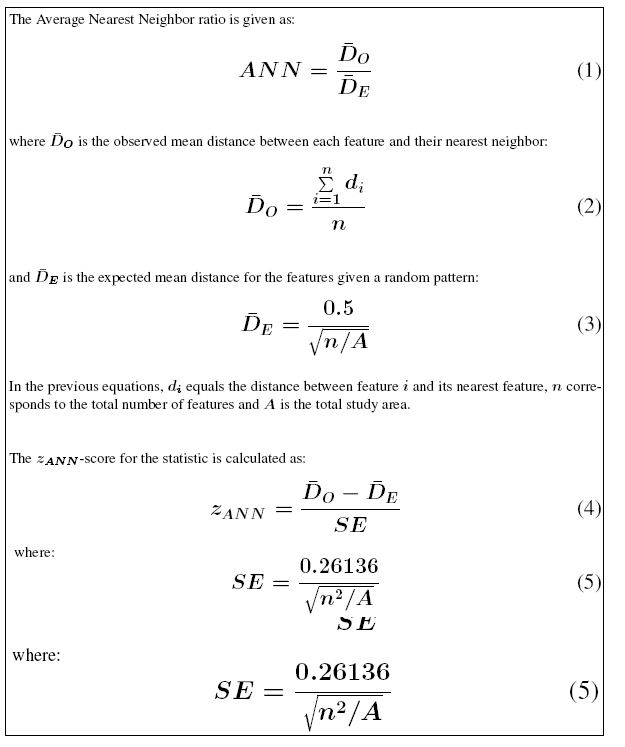
- a) In class we talked about the average distance between nearest neighbors (see here as well ) as a diagnostic of clustering. Compute this for the total sample area A, defined by the previous coordinates Submit that value along with a histrogram of the obtained values
- b) Repeat the above exercise but use boxes of size 100x100 km to compute the nearest neighbor distances. Slide the boxes over the area somewhat so they overlap. Submit those averages per box and a histogram of those averages
- c) Compare a and b above on comment on what this might be telling you about the nature of the data.
- d) Now its time to use K-means centroiding to define clusters. You will likely have to give it a starting value for the number of clusters. As always, google on various resources to find out more about K-means. Submit a plot showing your K-means results
- e) From those K-means results devise a way to determing a) the background event density and b) the overdensity of the K-means clustering. From that background density, also determine the scale of local peaks (within the K means clusters) whose central density (measured in some way) is 10 times larger than the background density. Report on those Results
Last part, we will see if any one gets to it ...
- Filamentary Structure: Now you will use the entire data - all 4000 or so points. Lets define a filament as a long thin rectangle (something like 2 km wide and 200 km long or something like that). Using coordinate detection coupled with event densities (the filament should have a higher density than the local backround) determine if there are regions that can qualify as filamentary (yes your eye-brain does a much better job of this). Submit a plot showing these filaments (rectangles) and their location
Remember all of this because we will be applying this to real life data like Earthquakes or the Galaxy Distribution or Zebrafish bacteria colonies later in the course.
|