Equilibrium Occupancy Assignment
This assignment explores the important issue of equilibrium occupancy in some ecosystem territory and the total percentage of that territory that must remain undeveloped to avoid the collapse of some species.
In general, a species will not inhabit all of
the available habitat as that would lead to extinction (or, in the case
of humans, neverending connected strip malls ....)
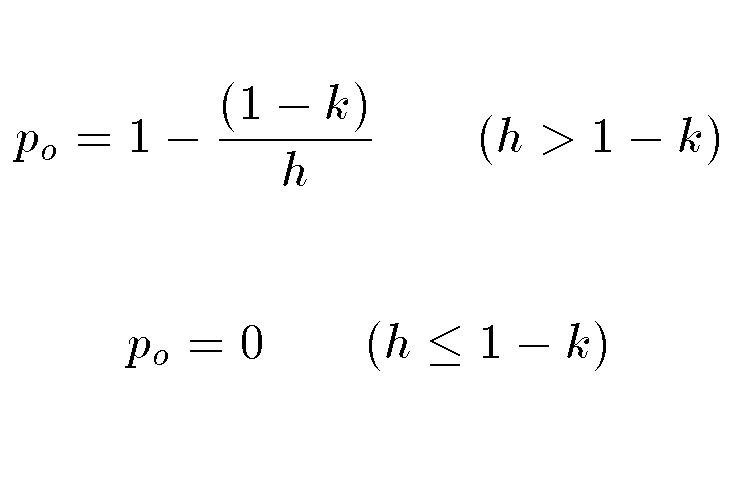
A working model is that
habitable and uninhabitable patches of land are randomly dispersed
throughout the forest ecosystem. This model makes an important prediction
for
po which is the equilibrium occupancy of suitable habitat
by females (the model assumes the males will find them ...) and it has
two parameters:
- h is the proportion of the region which is habitable
- k is the demographic potential of the species.
Demographic
potential is the equilibrium proportion of total territory that would
be occupied by females in a completely suitable region. k is not
something easily measured but po and h can be.
These are related by the following:

For simplicity we will use now use p for the time after
the coming of the chain saw and po the time before.
If h is known exactly (which we will pretend that it is) then the
variance in k can be determined as follows:
 where Np is the number of suitable territories that have
been observationally sampled for occupancy. Increasing Np
generally requires money/funding.
Below are the three data sets that have been obtained by three different agencies regarding Species X and its future survivablity in this changing ecosystem.
Data Set 1 (from the Government Study)
- p = 0.6
- h = 0.45
- Np = 100
Data Set 2 (from university biologists):
Data Set 3 (from the Sierra Club Study)
Your last task is to use this data to do the following for
each of the three data sets
- What strikes you as strange or inconsistent among the three estimates
of p and h within the Species X ecosystem? (Note the government is hoping
you won't notice this ...so just go ahead and use the values for p and h as stated by the government for the rest of the questions)
- derive k for each of the three data sets
- show the uncertainty in k (e.g. the standard deviation for k) for each of the three data sets.
- Is there any notable difference in the determination of k
between these studies? If so, what is the likely cause of this difference.
- Explain why the government study wasted funds relative to the
study done by the University Biologists.
- Explain why the University Biologists are critical of the
Sunshine Moonbeam study.
- Now, suddenly out of nowhere, The senior member of Species X speaks and says
"Yo, before the coming the great saw of chains, h in my 'hood was .78 ..."
Using that critical new piece of information, find the new value of po
and determine why SunShine MoonBeam is suddenly screaming "See, I told you so, I told you so ..."
- Now, using the observationally measured values of h in each study, map the
determined values of k including its uncertainty into the
critical parameter 1-k for each data set; remember,
this value means that if h falls below it, extinction of the
Species X will occur.
- Discuss the policy implications of the management of the Species X
habitat depending on which of the
3 data sets is adopted as the truth ...


