A Decision matrix is a straightforward tool that tends to force objective thinking about policy issues as various policy choices can be put on a grid at once and weighted. Indeed, it is the weighted decision matrix that can have real value. A decision matrix goes by a lot of other names, and before it was called a decision matrix it was basically referred to as a risk management matrix or a choice matrix.
The value of the matrix approach is the production of a visual that does a good job of summarizing the available choices in a way that linear brains can process pretty quickly.
We will start off with some generic examples. In general there is a list of criteria that are evaluated either qualitatively or quantitatively and a final sum can appear for each choice. Usually the highest value signals the best choice but it could be the lowest value depending on your design. In the example below,
based on 5 criteria, choice C becomes the winner. Important:
in this example all the criteria are equally weighted; you could make choice C even more obvious if you assigned twice the weight to reliability (so multiply by 2); in that case the sums would be 15, 16, and 22.
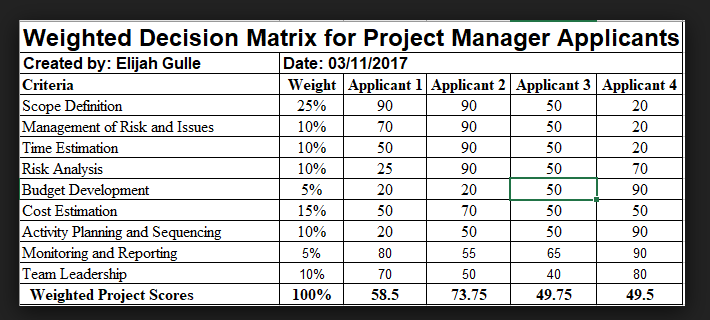
Here is a good example of a weighted decision matrix that produces a clear winner. I have suggested we use a similar process when we hire faculty, you can imagine how that went.
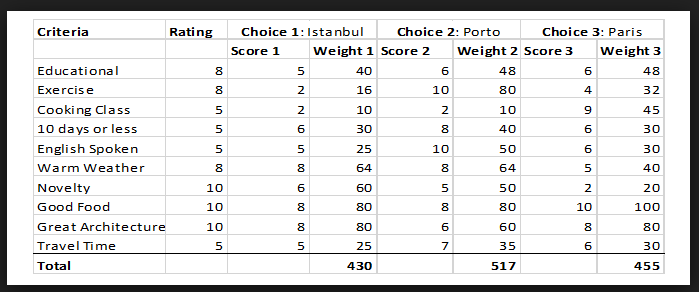
Here is an example of a decision matrix regarding taking a vacation to one of 3 destinations. So if you really want to go to Paris, how could you change the weighting (=rating*score) to do this and would that reveal biases?
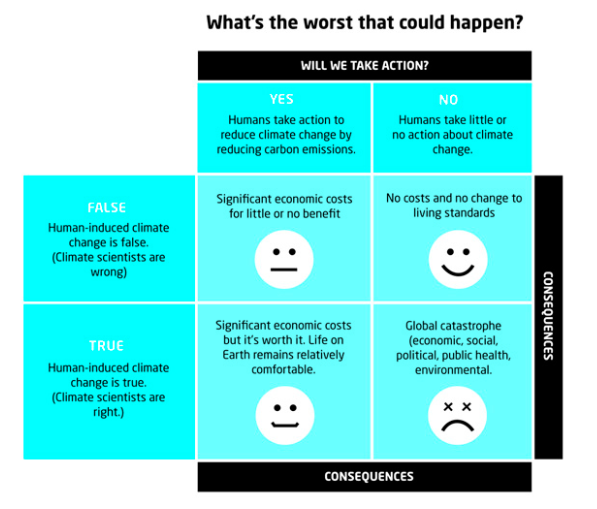
The simplest qualitative form of a decision matrix or a truth table as it was once called, is that the worst possible outcome
appears in the bottom right.
A 3x3 matrix example is shown below
A typical risk management matrix. Likelihood x Impact
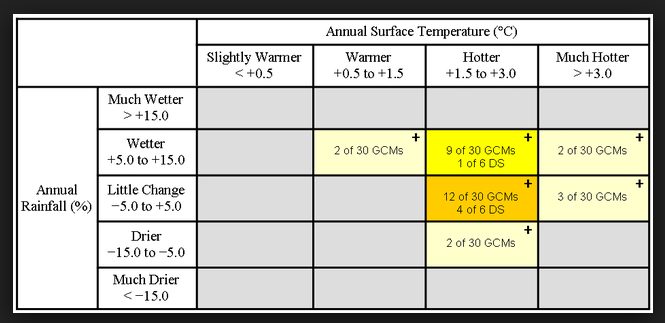
A qualitative evaluation of most common attributes in a sample of 30 Global Climate Models (GCMS) in terms of model predictions for temperature increase and rainfall increase/decrease.
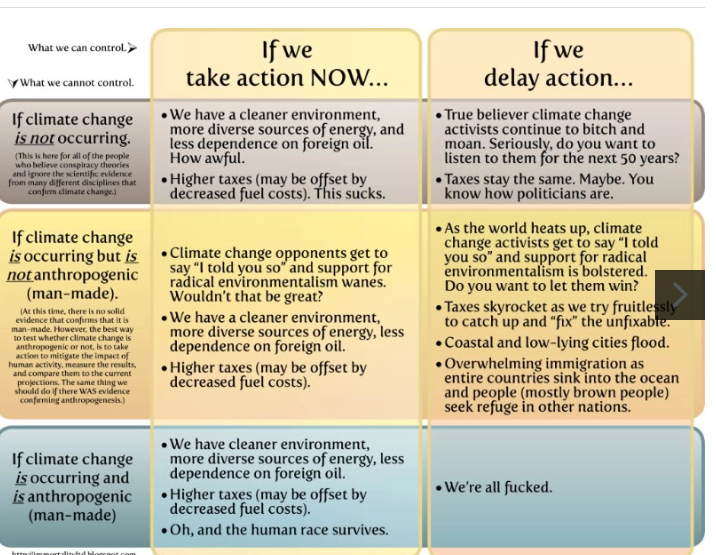
Another qualitative example which centers on control and action. Note with bottom right corner.
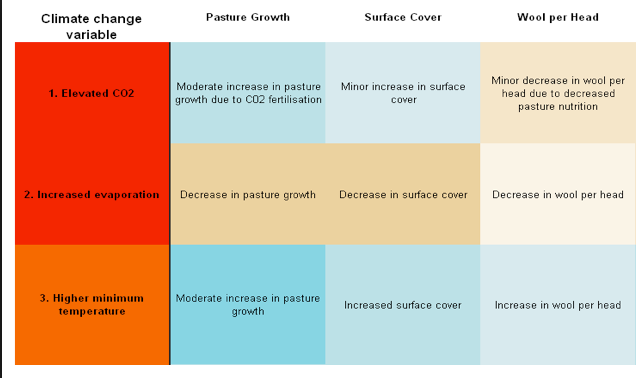
Here is a small example of climate change elements that might effect the characteristics of a pasture in which sheep graze to transform grazing fuel into wool. In this case the bottom right hand corner is the best possible outcome for wool per head.
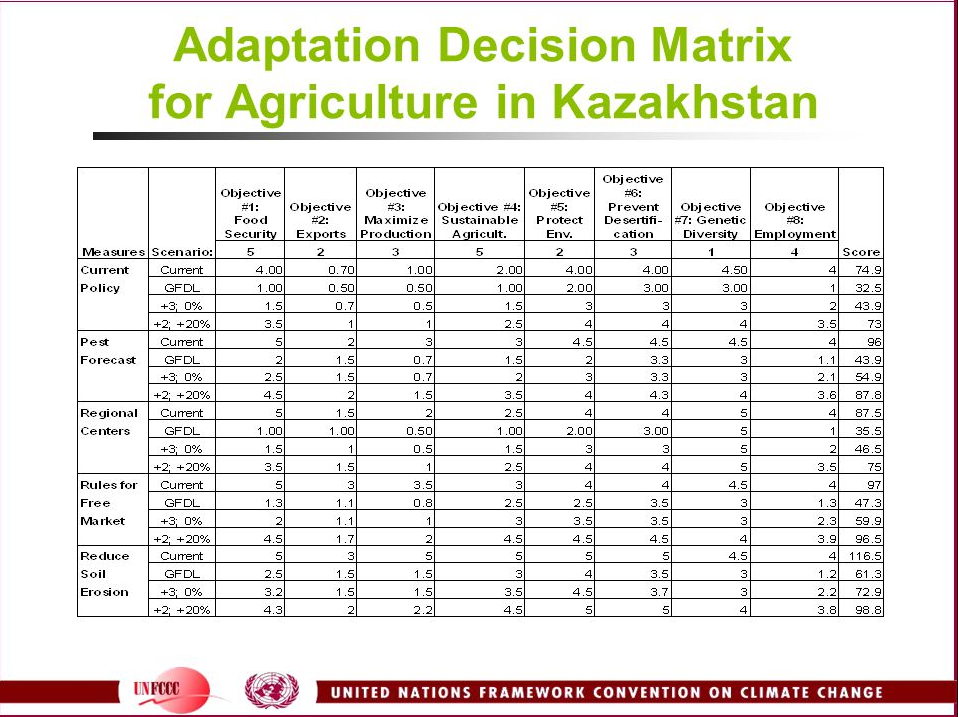
In some cases, the decision matrix can be quite extensive. While opaque, this example does end up in a large dynamic range of scores which indicates familys of good choices and familys of poorer choices.
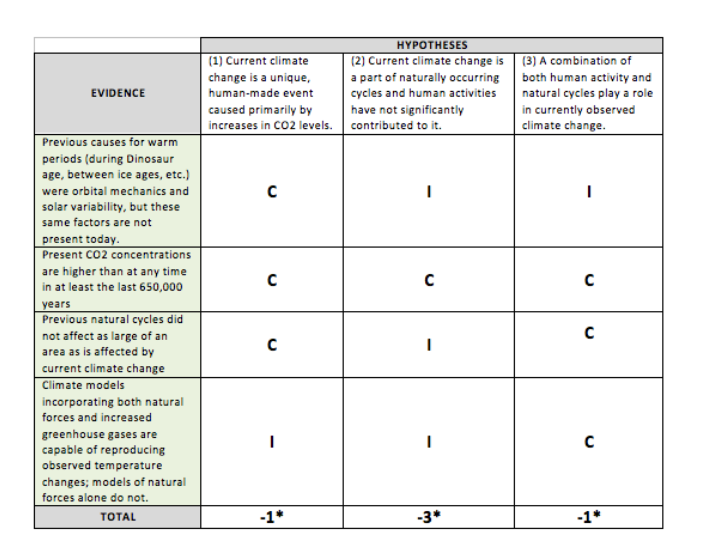
Now this is a very interesting variant particularly for public outreach as you want to identify the hyopthesis which has the least number of inconsistencies associated with it, as compared to the data. A value of C stands for consistency and is given a score of 0, a value of I is for inconsistency and is given a score of (-1). In this case hypothesis 2 is the most inconsistent, while 1 and 3 are equal.
This form of a decision matrix will form Part A of your next assignment.
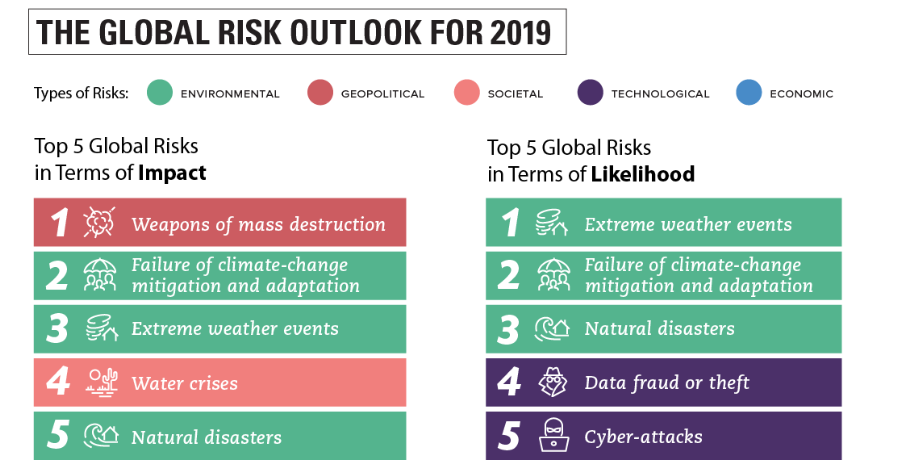
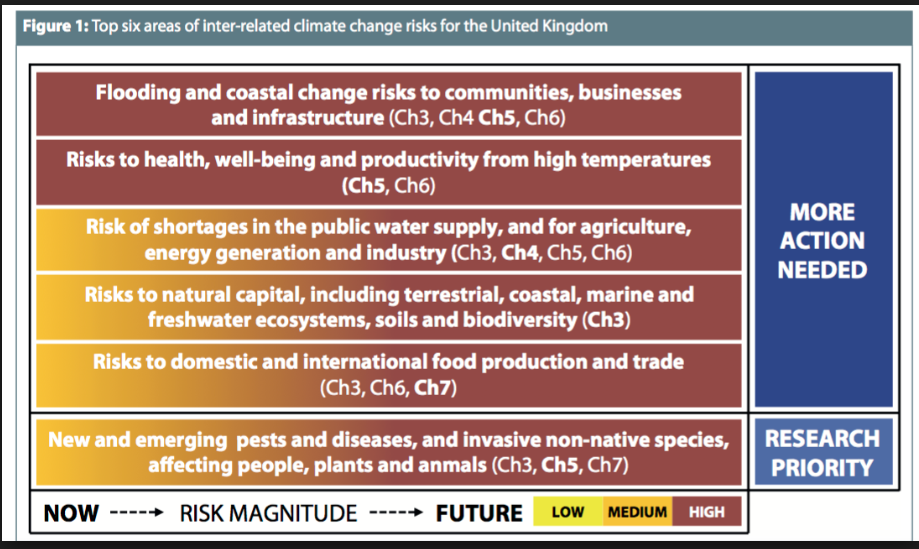
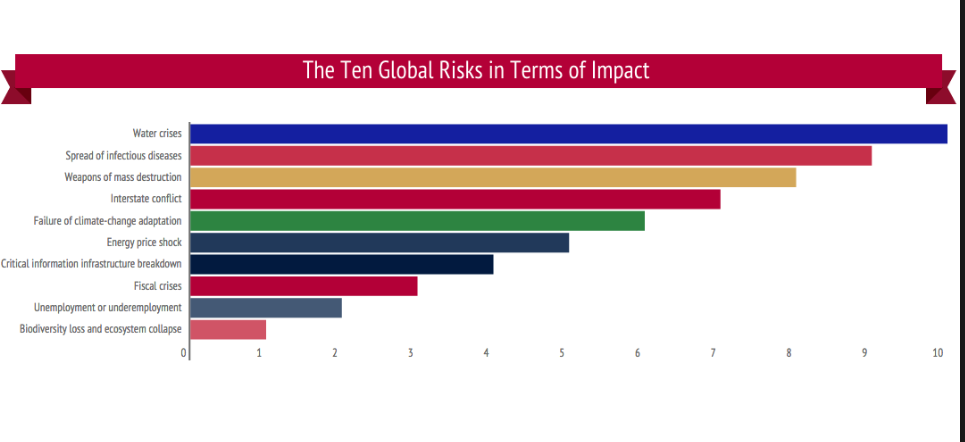
Another way to think about this is a matrix form of Impacts, Likelihoods, and assessment of the need for more research and more investment in mitigation/adaptation.
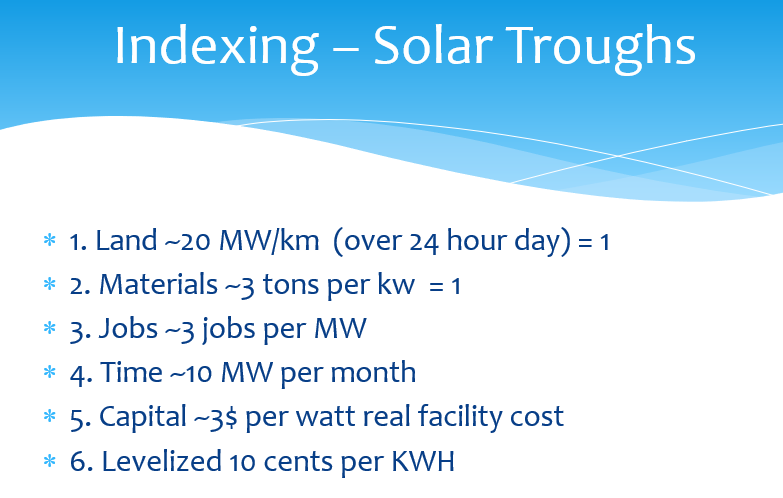
Part B of your assignment is some combination of risk impacts, likelihoods and adaptation investment in the form of producing a weighted quantitative score. Here as an example that I have used (both in classes and the literature). The goal is to develop a set of criteria to evalute that kind of choice for renewable energy technology could be made (against that criteria). The overall matrix is normalized to the infrastructure requirements of using solar troughs so that all other technologies are compared against that baseline.
Here are the chosen criteria
The numbers below are advantage numbers - e.g. wind is 3 times less material intensive than solar an is 2.5 times more land efficient than solar. Waves are 5 times more material intensive, etc.
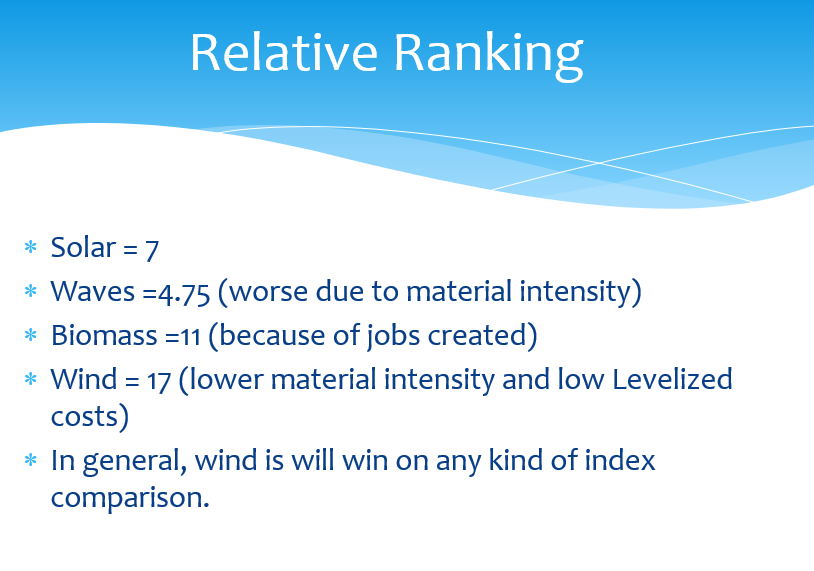
Finally you make a cumulative weighted index and then just determine the overall advantage scores. For solar troughs that would be 7 so scores above that represent a better technology choice (again based strictly on these 6 criteria) and scores below 7 would be a worse choice. The interesting thing about this particular exercise is that no matter how you vary the weights (within reason), the same technology always comes out on top - in this case by a large factor. This makes this approach somewhat robust.