Upload
the Assignment Here
module load mpi-tor/openmpi-1.7_gcc-4.8 a) Before any smoothing is done, write a quick routine that determines the local peaks (on a monthly basis) and make a histogram of those peaks (in units of months for the time line). Is there evidence for periodicity in those monthly peaks? b) The usual procedure would be to calculate the annual ENSO index and plot a smooth vesion of that. Example plots for raw and smoothed data are shown below: 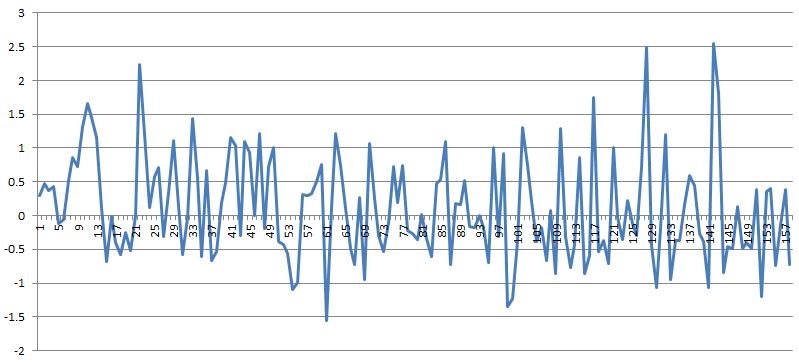 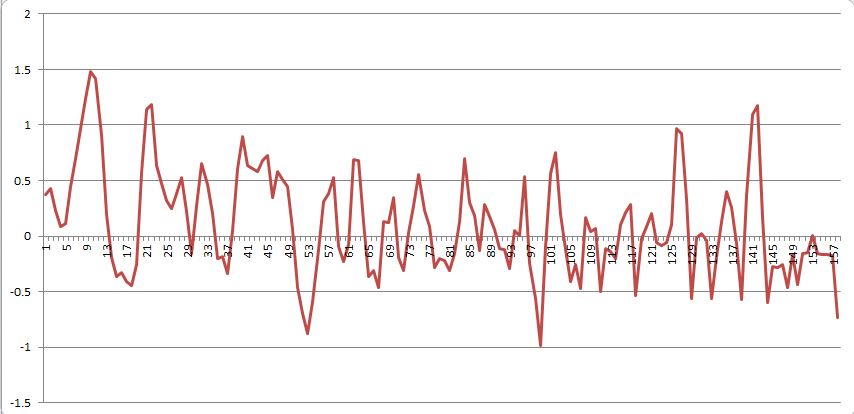 c) Produce a plot of the best solution you obtain against the data by using 8 processors and as many iterations as you want to find the minimum chi squared value. Keep track of the minimum chi square value as a function of both iteration number and number of sine waves. Include a table that shows the combinations and the resulting law of diminished returns. d) Within a small range of chi squared about your best solution, find the number of function combinations that are allowed within that small range. This is a measure of the degeneracy in this problem (which could be large). e) There is some reason to believe that this data set is not correctly calibrated throughout all time steps. See if you can improve your fit by what you judge to be "poor data". As usual we will discuss this assignment in class on Friday. For Craig: Yeah, go ahead and try to fourier transform this data!! |