This is a coding/data exercise to be done in class today. Work together on this but only 1 person should be writing the actual code.
This exercise should take 45 minutes or 30.
Procedure:
- copy the data filed called data.txt on ~dkmatter/sciprog/data.txt on ACISS
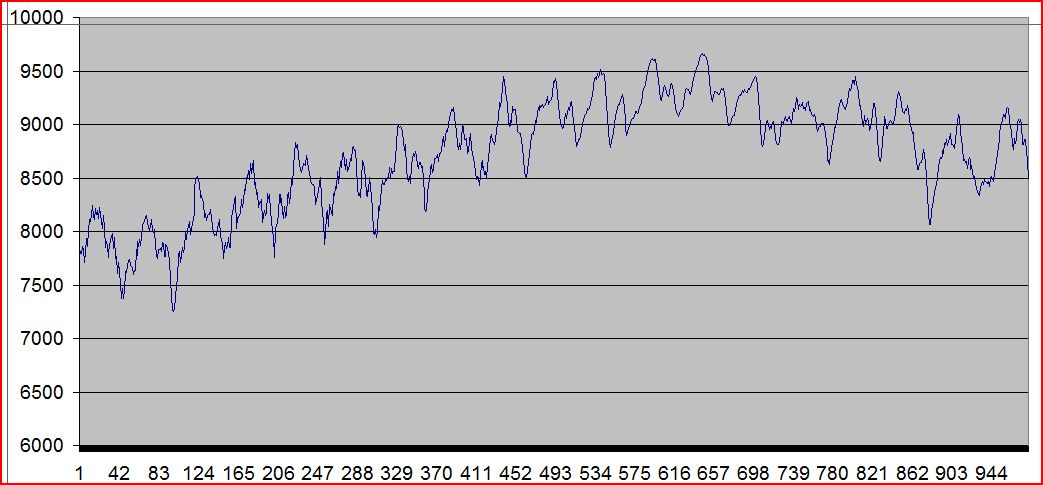
- The data is two columns with 1000 events. Smooth the data using any procedure that you want - you need to balance your smooth width with reduced noise vs loss of feature resolution. Your smoothed data
set should look like this:

- Write a function fitter: The simplest one is a sine wave + linear
equation and sum the two together. Obviously you will need more than one linear equation because of the slope change. Alternatively you might be able to fit a higher order curve to whatever you think the baseline is, but the only way to fit the harmonics is with a sin wave.
- You will want to write code which will immediately pass through your parameter changes (line slopes, periods, amplitude, etc) and draw
the function through the data; an example will be shown in class.
- You will need to program in the residuals (difference between the model and the data) and calculate the minimum of the sum using chi2 technique:

fo = data; fe = model values; don't worry about normalization for this statistic, the above form is good enough to determine a local minimum (best fit)
- When you have a best fit, predict the value for x=1200; we will compare these values and then I will tell you what the data is.
- Upload your plot with fits to
http://homework.uoregon.edu/upload/what
|

