A bonus exercise:
Check your random number generator using the KS test:
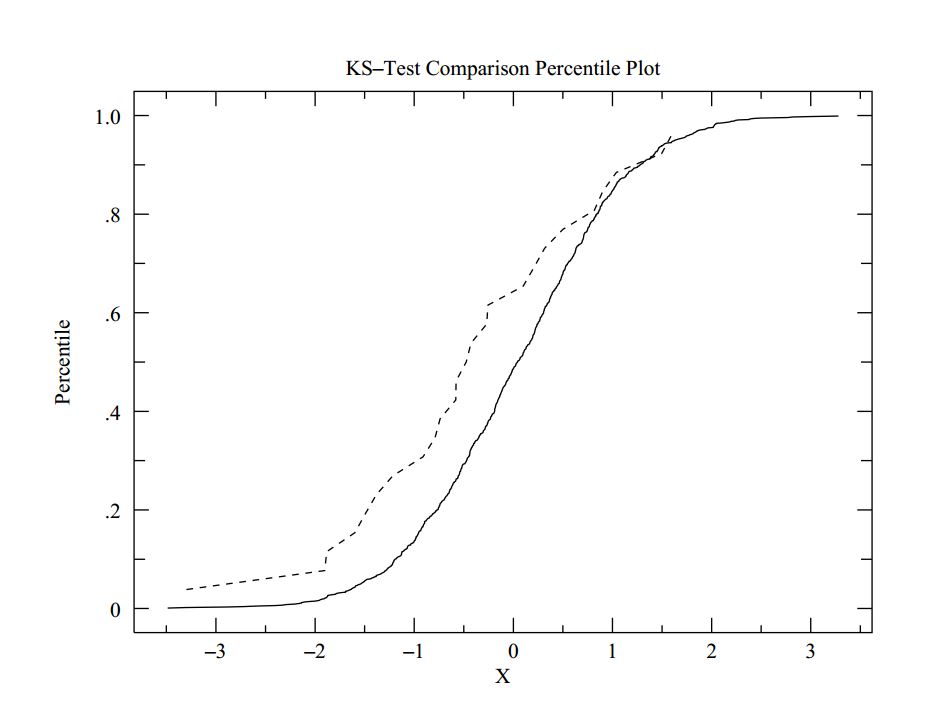
The following plot shows the cumulative frequency distribution
for 1000 random numbers generated with mean = 0 and dispersion = 1. The x-axis is therefore in units of standard deviations.
2. Use the KS Test Calculator for this (plot generation is at the bottom of the results page)
|