Disk/Cylinder Tutorial
Procedure:
-
Download this file called disk_out_ref.ex2
- Open Paraview to get this screen:
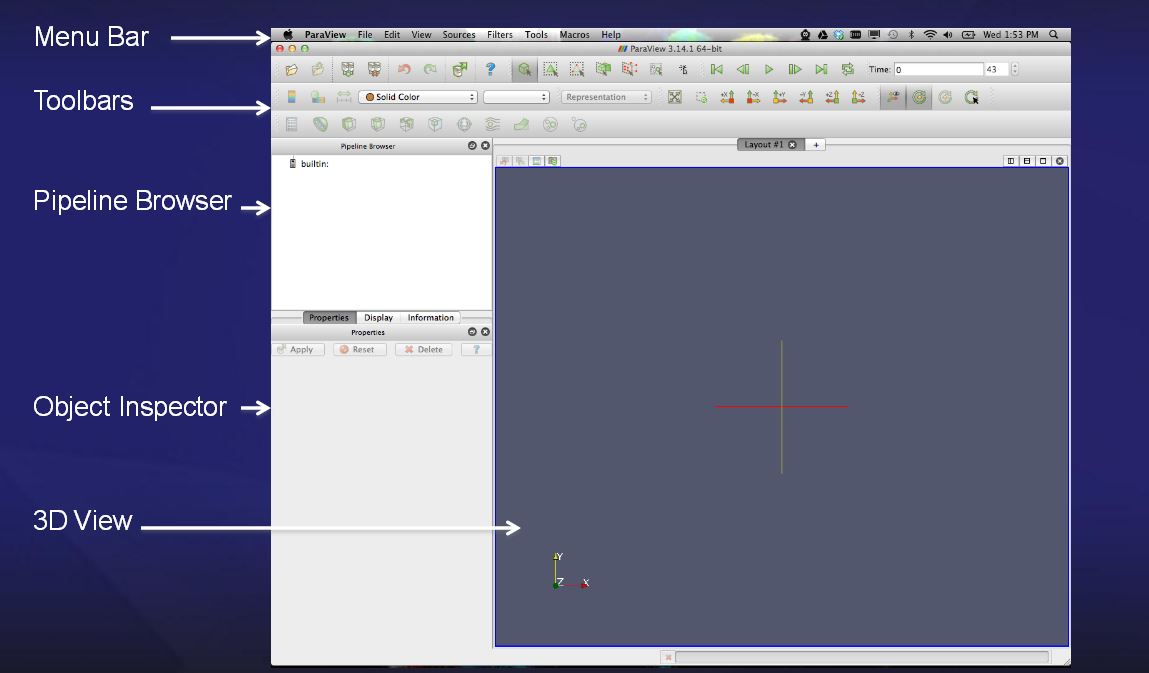 Note that the red, green, yellow axis in the lower left are "orientation" axes and not coordinate axes. This will become confusing later. You can turn them off (later).
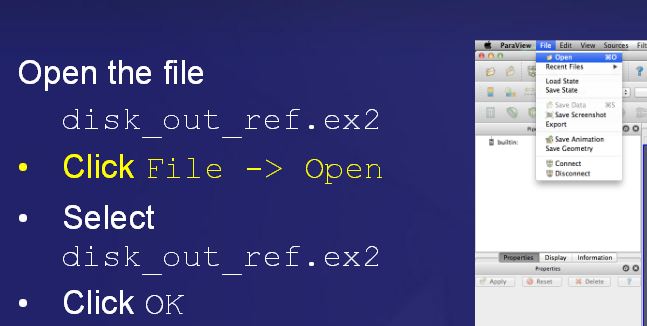
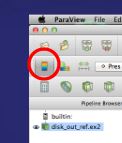
- Open the File:
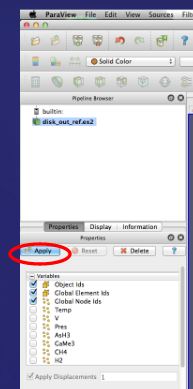
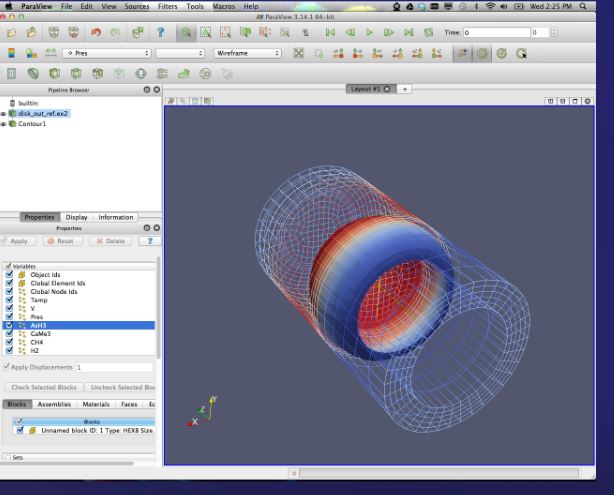
- After Selection the file appears in the Pipeline Window - highlight it and select apply and select ALL Variables in the list (the screen shot just shows the first 3 selected - select them all) and then click on apply
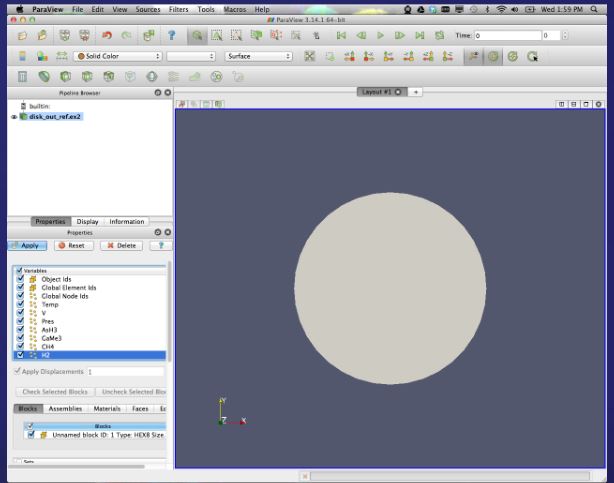
- You should now see this, the cylinder outline of the data set extent (and all variables are selected):
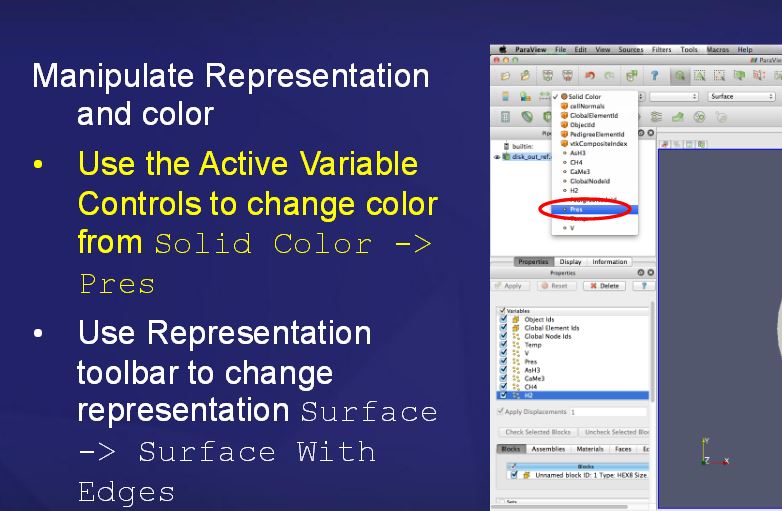
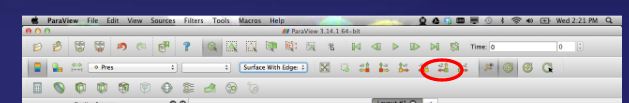
- Screw with Color and change surface to surface with edges in the drop down menu.
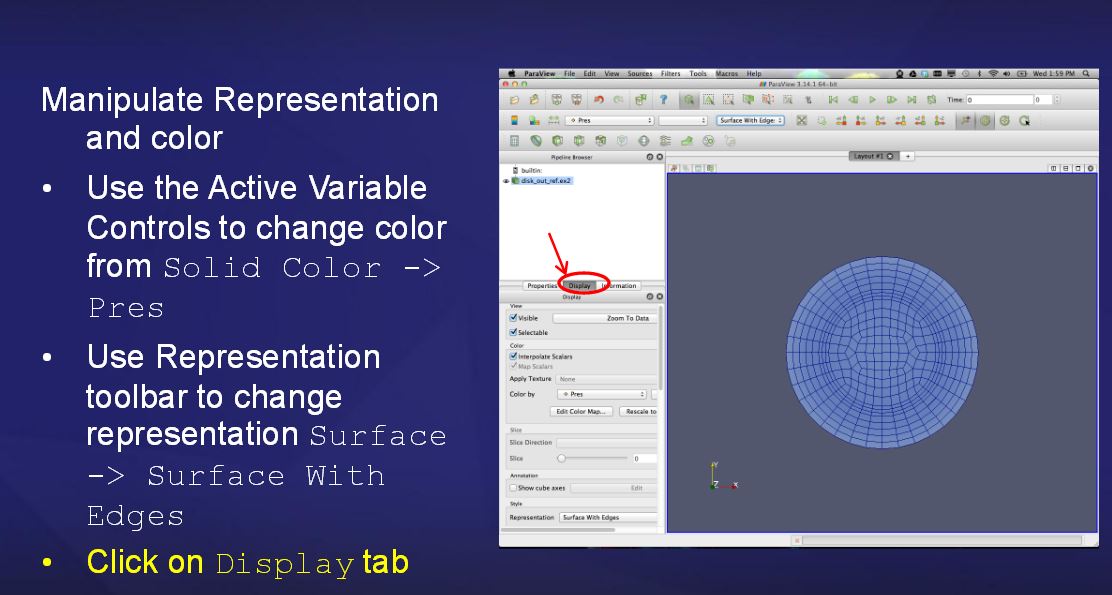
- Click on Display to see this:
- Enable Color Bar:
- Click the +z (top down view) button
- Should look like this now:
- Move your mouse around - get confused, try to get this view:
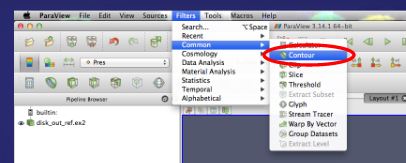
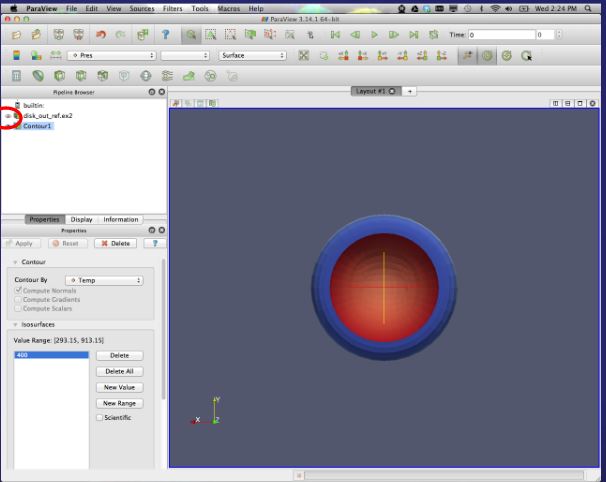
- Click on Filters --> Common --> Contour
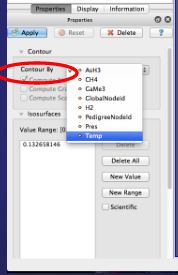
- Your likely still in display mode so click on properties to get the correct menu. Choose Countour by Temp then immediately below Click "Delete All" and "New Value" and enter 400 and then click Apply
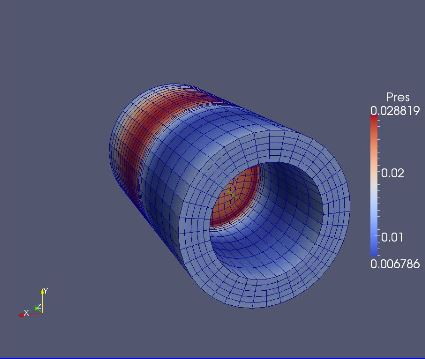
- and voila - notice that in the pipeline browser window you have a new entry called Contour1. Notice also the little eye icon as circled. This icon is important so CLICK ON IT for the file named disk_out_ref_ex2 and change representation from surface with edges to Wireframe to get to the second image below
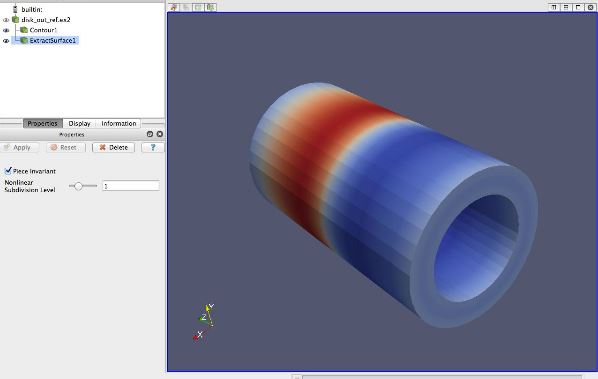
- Now Click Filters --> Alphabetical --> Extract Surface and apply: Notice that a new file name has now appeared in the pipeline browser. To get to the image below you might have to select the disk_out_ref file and change wireframe to surface.
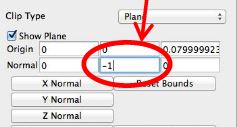
- Go back to filters --> Common -- Clip and that brings up
this panel (check show plane if you want):
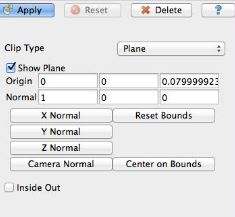
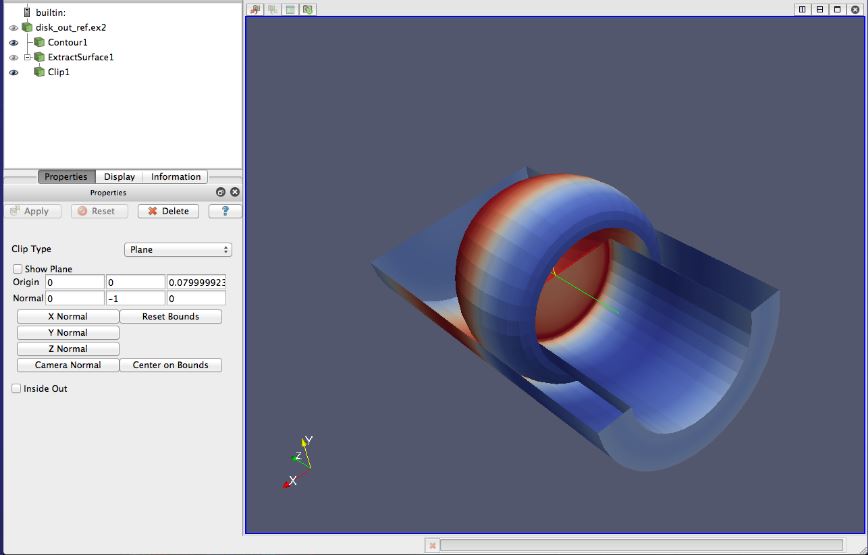
- Click Y Normal and enter in -1 in the second box and click apply
- Select Contour1 and Clip1 as the active layers to display
so that you image now looks like this:
- Getting the hang of it? (this must be a surfing term, if anyone wants to research the origin of this expression, do it and visualize it.
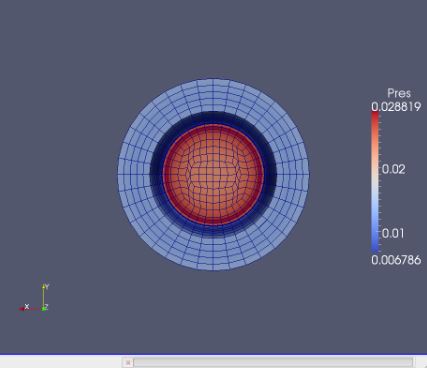
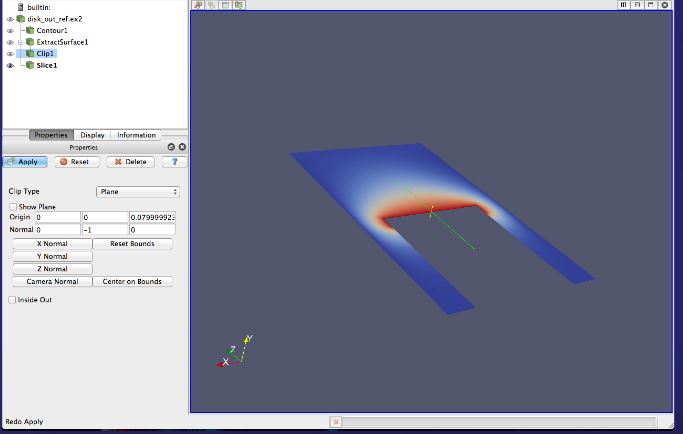
Select the disk_out_ref.ex2 file in the pipeline browser and then Filters --> Common --> Slice and apply.
Click eye next to ExtractSuface1 and Clip1 to hide that plot. Click on Y Normal and click apply. In Display change Color by to Temp to get this. Note, that Y normal should be -1 and Xnormal should be 0 to get the orientation as shown below. Its possible that those entries got changed magically while you were doing the steps above.
General note - your pipeline browser now has a number of "layers" in it, you can click the eye to toggle between showing these layers and hiding them. When you get confused its a good idea to use this capability.
- Time to create streamlines.
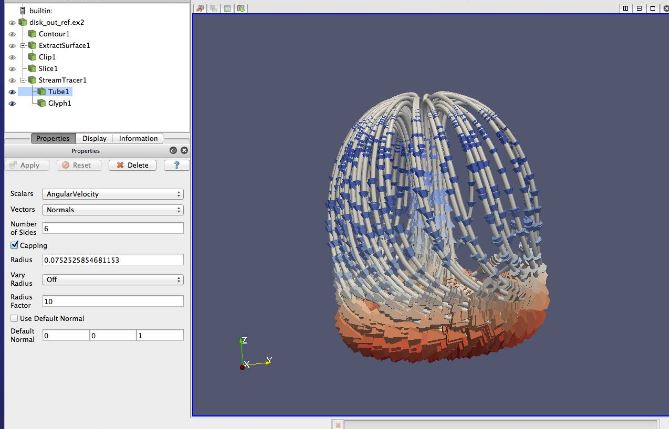
Select the disk_out_ref.ex2 file in the pipeline browser and then Filters --> Common --> Stream Tracer and apply. Then Click on SteamTracer1 in pipeline browser and click Filters --> Alphabetical --> Tube and apply
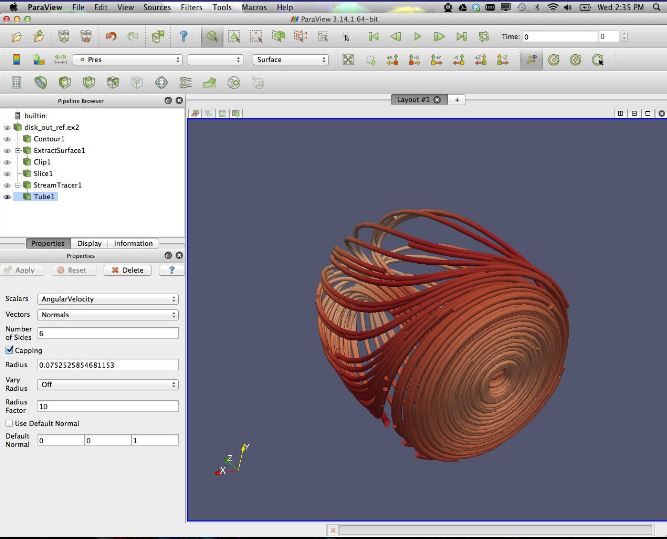
- Then Click on SteamTracer1 in pipeline browser and click Filters --> Common --> Glyph. See the new parameters under the Apply area and select V in the Vectors Box and Cone in under Glyph Type and click apply. The click on Tube1 (pipeline browser) and change to Solid Color
At this point make sure you Save State (File --> Save State) as
the next step may crash things. If it does then reload the state and move on to Volume Rendering (the last step).
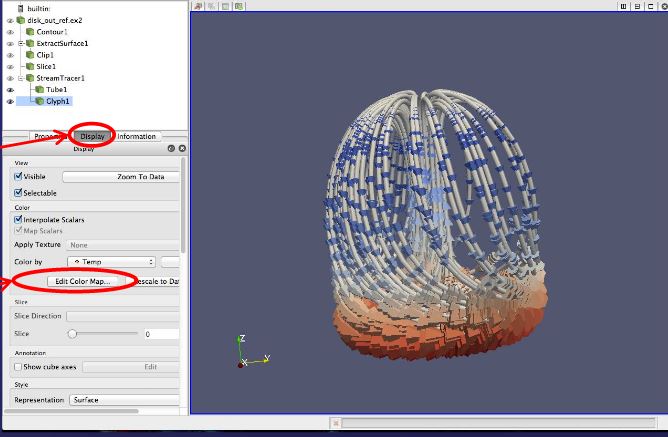
- Click on Glyph1 in pipeline browser and then display --> color by temp and then edit color map: Note that Paraview might crash when you click on color map.
- Choose Present --> Select BLUE to RED HSV --> click OK --> click close (lower right hand in dialog box)
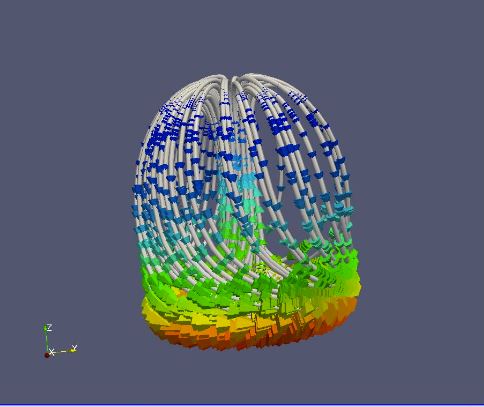
- Click Edit on the top tool bar and View Settings. Click Choose Color and drag the slider all the way down to black. click ok and ok.
Click and Show Clip1 (in pipeline broswer). Click display --> edit color map --> show color legend --> close. Select color legend (white rectangle will appear) and move it to the top of the viewer.
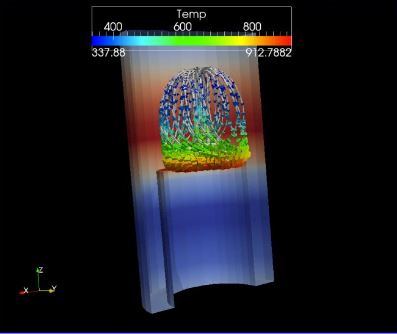
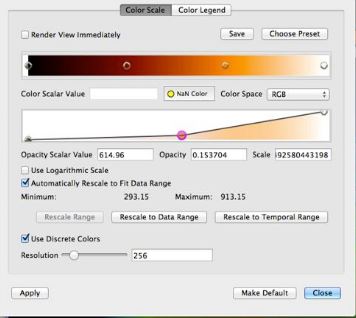
- Last Step --> Volume Rendering:
Select the disk_out_ref.ex2 file in the pipeline browser and then representation select Volume. Hide Clip1. Click Display --> edit color map -- preset --> choose black, orange .. RGB --> modify Function as shown here:
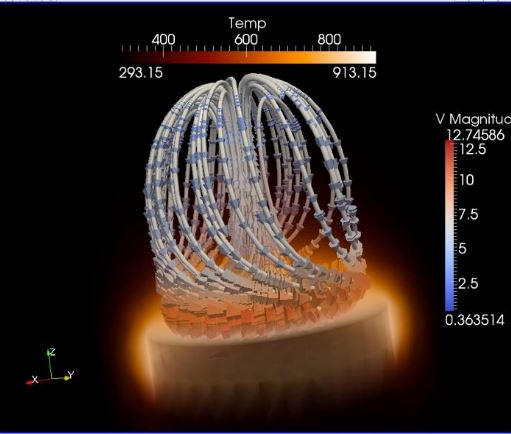
- Your done:
|