Part I:
In this assignment we will again be concerned with list management of network retrieved data. You will do operations on the list and make various outputs to turn in as requested in the red text below.
If you have familiarity with using JSON you may do this assignment using that utlitity but you certainly do not have to.
In any event, here is a JSON tutorial
In addition we will also want to experiment using Panoply on this data as you turn it into a netCDF file as part of the exercise.
Follow all the instructions below, explicitly, even if some of them seem stoopid to you:
- Getting the data:
Using Web Services:
Web services are internet enabled pieces of code that serve up requested data over the well established HTTP protocol that is also used by web browsers. When you access any website through a browser, a network connection is made and data is transferred using the HTTP protocol which allows for basic operations on data including GET, POST, DELETE, etc. In this context we'll think of web services as a data retrieval method and therefore GET is the only operations we'll need to concern ourselves with.
Please note that web services GET has overall behavior that is sometimes browser dependent. That is, maybe the GET list will appear in your browser window, or maybe it will get downloaded to your downloads area. Some if the browser window returns a blank screen, check for the file download.
In this case we are going to retrieve weather data using a specifically formated URL for different stations, A file of station codes is located here for counties in Oregon.
The basic web services site is located at http://data.rcc-acis.org That page contains the documentation for hte various kinds of queries you can make. Yes, when you first go to it you will be overwhelmed and say, holy shit, I don't want to do any of this ; relax, it won't be that painful at all.
Getting the data: Use this URL: http://data.rcc-acis.org/StnMeta?county=41039 (paste it into your browser) to generate a list of raw data for this county (which happens to be Lane County).
- Save that file as a text file then Produce a file with just the station ID (5 digit number which is uid number)) and the elevation in it and ) turn in that text file as well as a histogram of the elevations . I highly suggest you mainuplate this text file using the unix shell builtins of 'sort' and 'grep" (refer to the uniz shell tutorial).
- From that list produce another file with all the Station IDs for Eugene, Florence and all stations between 1000 and 2500 feet in elevation. Turn in that file - we will be using the actual station data later.
- Paste This Specific URL in to your browser
http://data.rcc-acis.org/StnData?uid=15218&sdate=2009-01-01&edate=2010-01-10&elems=1,2,4,10,11
This will return a list of data for the offical airport station at Eugene. Refer to Table 3. Element Codes to know what elems number corresponds to what variable.
If you wish a csv list then append &output=csv immedially after the last element in the list above (which would be 11 in this case).
Query that data set and
return the following information:
- The dates of the highest, lowest temperature and greatest precipitation.
- The longest drought period (days with zero rain)
- The wettest 15 day period
- The number of days above 90 and the number of days less than 32
- Now change the starting data to 1950-01-01 and the ending date to 2017-01-01; this obviously will produce a large data file. But this is why you program to deal with this large of data file.
We can now do a number of custom operations on this file to return results, so here we go:
- Determine the number of days above 90, in 5 year periods, starting in 1950 from July 15 - August 25. Produce a plot of year period vs number of days.
- Find and report on the three longest drought durations in this weather record
- Determine the total amount of precipiation, in 5 year intervals, staring in 1950 for the winter rain season Nov-Feb.
Produce a plot of year period vs rainfall amounts. Comment on anything that you find to be unusual in this plot.
- Determine the day of the year which has the highest and lowest cumulative rainfall over this period of record.
- Snowfall in Redmond OR. The station uid is 15234 and we only care about element 10. Adjust the URL accordingly. Note that T means trace so consider that to be zero.
- Define two snow seasons 1) Nov 1 to Feb 15; 2) April 1 to May 15. Determine the total amount of snowfall during these two seasons for every year form 1950 to 2017 and make plots of those results. Comment on any trends that you notice.
Part II:
This is a small netCDF exercise.
- Download and install the panoply viewer.
- Login with some shell to your ACISS account:
a) mkdir nc
b) cd nc
c) cp ~dkmatter/nc/nc_create.py .
d) edit (using any editor) nc_create.py and change nx and ny to 600 and 1200 (gedit is a simple text edit program on ACISS)
e) module load python
f) python nc_create.py produces an output file called xy.nc
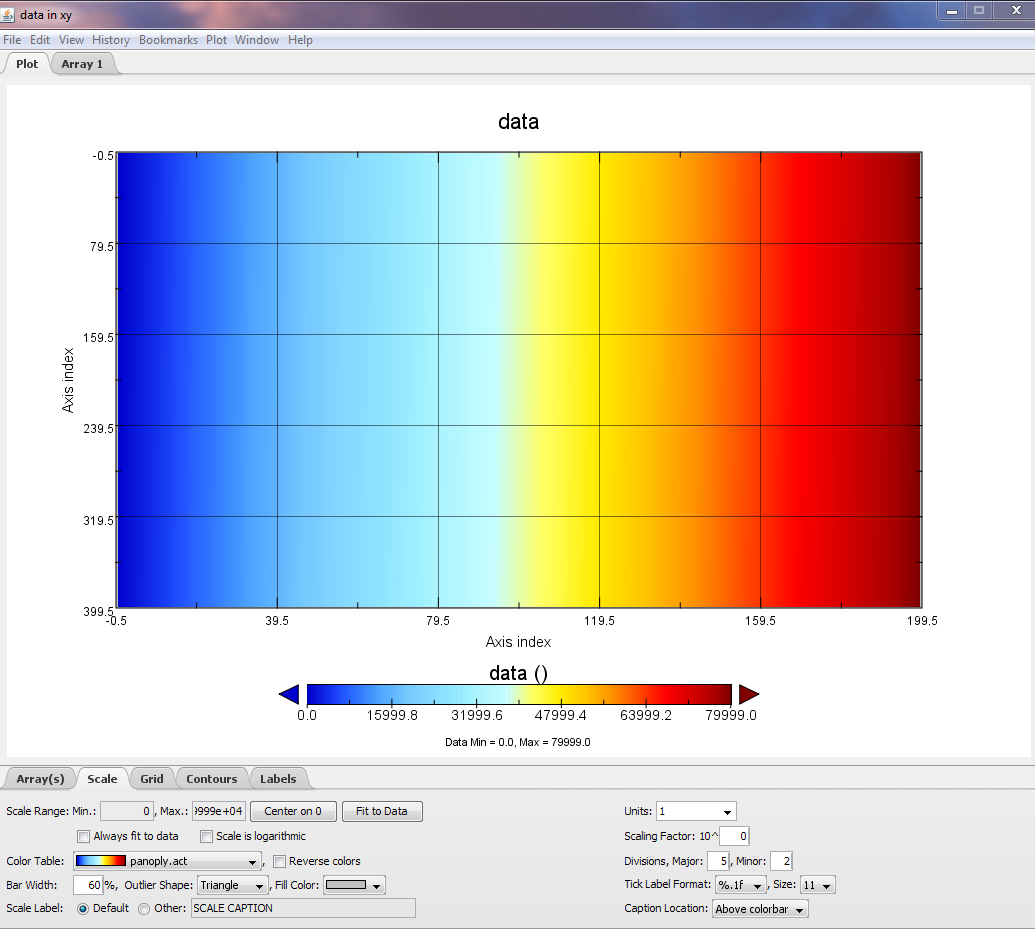
g) launch panoply and view the file - it should look like this
There are other ways to produce an nc file and lots of documentation out there on how to do this - I just gave you a particular example and of course it is brute force.
h) hit the array tab and look at the array number population - what do you think the command
arange(nx:ny) in the program nc_create.py does? Include this answer in your write up.
i) Now paste this URL into a browser
http://data.rcc-acis.org/MultiStnData?state=OR,WA&date=2008-07-04&elems=maxt,mint
Convert this into a netCDF file (a .nc file) in which you have latitude, longtitude, and max temperature as the Z variable.
Produce a plot in panoply of that array and include a screenshot of that in your write up
|