To use some data to characterize the magnitude of the
UHI phenomena.
To use some data to characterize the magnitude of the
UHI phenomena.
To understand the energy balance and energy flows
at the urban/rural interface
To develop mitigation strategies
Introductory Flash Movie - See the Author!!
To use some data to characterize the magnitude of the
UHI phenomena.
To understand the energy balance and energy flows
at the urban/rural interface
To develop mitigation strategies
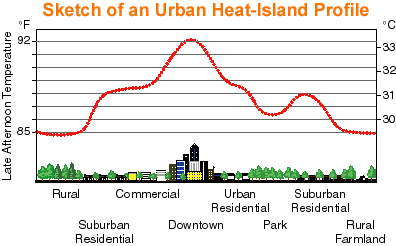
In particular, asphalt/concrete have relatively low specific heats
but relatively high thermal
conductivity. This physics means that concrete/asphalt can absorb heat and increase
their temperature relatively fast and once they have become heated, they can effectively
radiate that excess heat to the atmosphere for some time.
Because it takes a few hours for this material
to absorb the incident sunshine, the temperature contrast between the urban and rural
areas usually maximizes in the late afternoon. The actual value of the temperature contrast
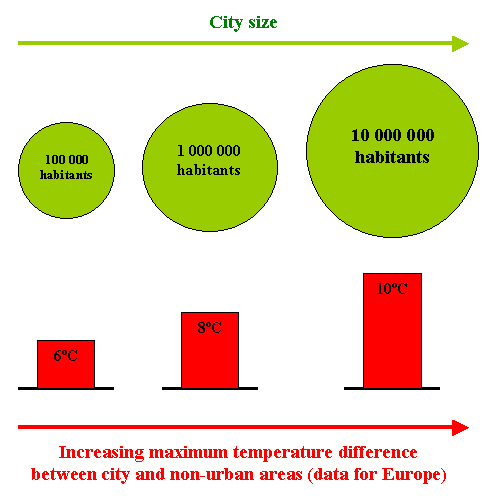
varies as a function of concentration of materials on the landscape. This is summarized in the
Figure below:
|
|
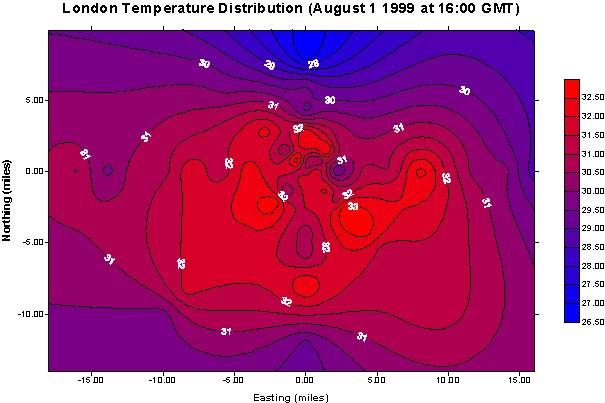
The data below refer to some averages for cities in europe.
|
Clearly the relation between city size and maximum temperature difference is complex and depends upon the landscape the city is set against. For instance, a large metropolitan area in a desert, probably has a smaller signature than a similar size metropolis set in a cow pasture.
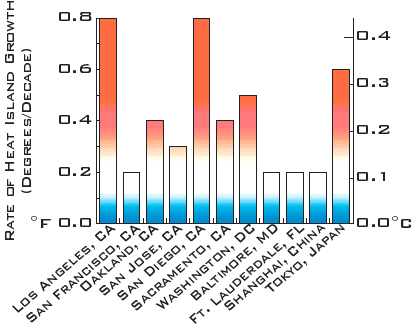
The data below, show the trends in the UHI effect, in units of degrees C or F per decade, for different urban environments for which sufficient data exists to define a trend. Note that this data is averaged annually and does not refer to the maximum tempearture differential as we have used previously. Thus, for instance, Los Angeles shows a growth rate of .8 degrees F per decade meaning that every 10 years, the average annual temperature in the LA metro area increases by .8 degrees relative to the average annual temperature in the surrounding (rural) environment.
|
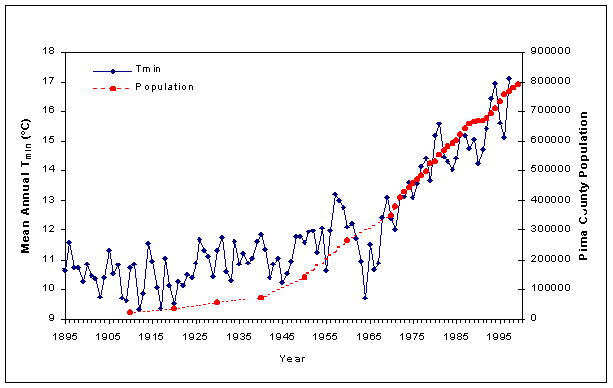
Pima County Arizona, where Tucson is located, is a rapidly sprawling urban disaster
in an arid, naturally hot climate. The figure below shows the very good correlation
between average annual temperature and the county population. In this case, its
actual average temperature which plotted and not tempearture differential between
the rural and urban environments. That part is coming next.
|
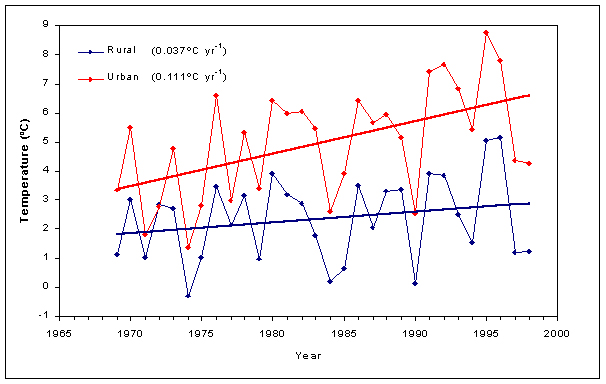
The figure below shows the period of 1969-1998 which compares the average annual temperature between the urban areas of Pima county (e.g. Tucson) and the surrounding rural area (which is mosly inhabited by cacti and prairie dogs).
|
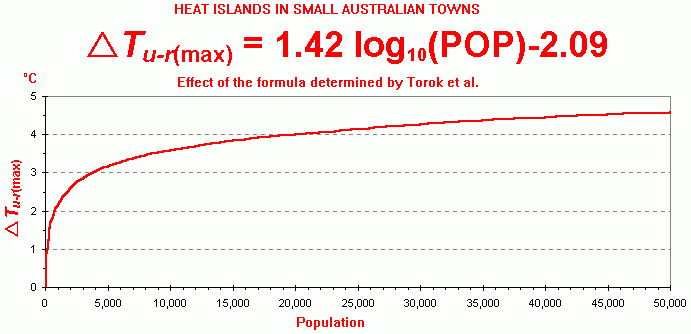
Lastly, the image below as constructed using data from small towns in Austrailia. This study is unique as its the only one that has studied small scale systems. The formula that shown as the fit to the data is a non-linear formula.
|

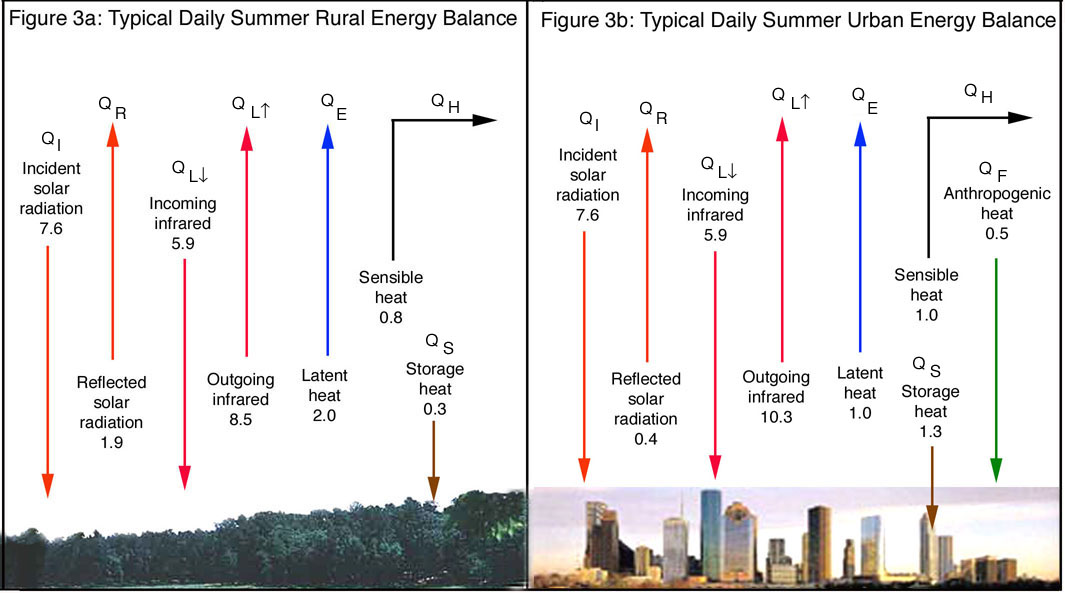
In this way the local energy balance has been altered due to the presence of these artificial materials that are now embedded in the natural landscape. The figure below is a representation of artifically induced energy flows that can occur