In this exercise you are to attempt to detect the configuration (mass and separation) of various systems. Each host star is 1 solar mass.
A successful detection means that the white line model fit, obtained by adjusting the mass and distance in the third step of the applet goes through the red data points. Note the gray bars around the red data points represent the instrumental precision.
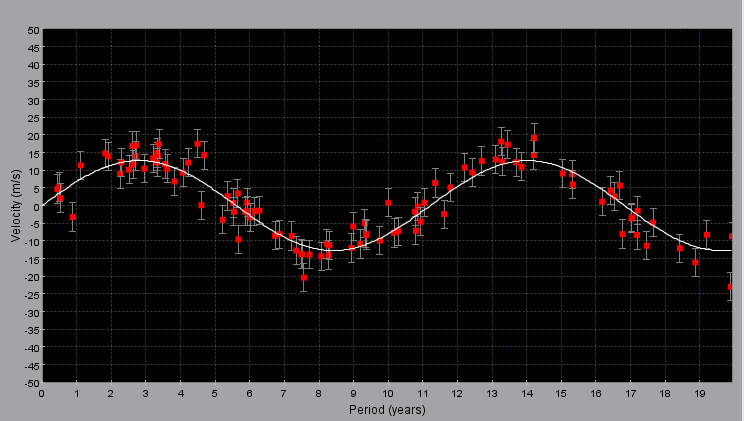
Here is an example of what a successful model fit would look like in the simulator.
The white line (which represents the model) should go smoothly through all of the data for their to be a convincing detection. The role of instrumental precision (coded as error in the simulation), the time span of observation, and the rate at which the object is sampled (how many times it is observed during the time period) are all important in producing a detection.
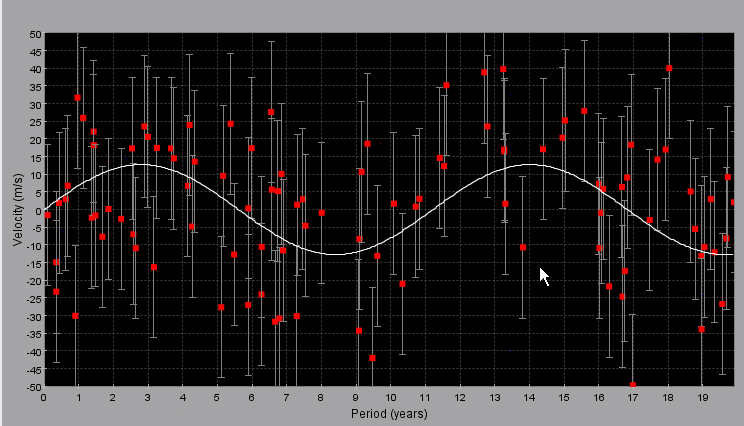
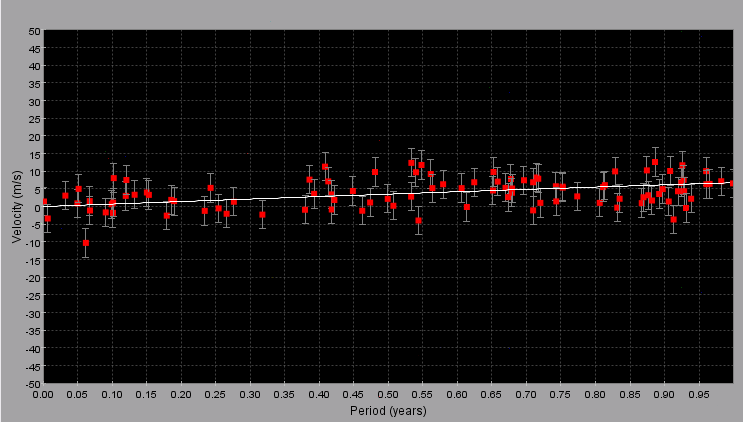
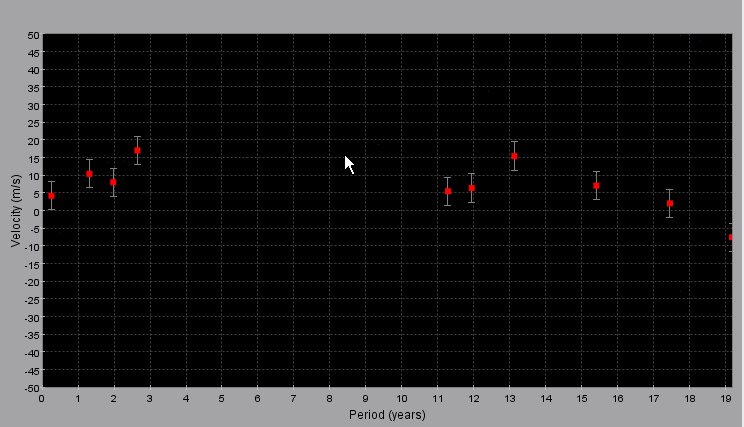
The following three figures show the exact same system as fit above, but this time observed with instrumental parameters that don't allow a secure detection.
Poor instrumental resolution - too much scatter around the right line to believe that the fit is real -it could all be noise
Insufficient observing time - here we have only 1 year of observation and the orbital period is 11 years - it would be difficult to say that we have detected a planet here.
Insufficient sampling - here we made only 10 observations in 20 years - hardly enough to define a sine wave:
Within the simulation, you can set these 3 items.
 Adjust the mass to 1 jupiter mass and notice
that's close in amplitude to the data but it seems out of phase
Adjust the mass to 1 jupiter mass and notice
that's close in amplitude to the data but it seems out of phase
adjust the distance to 5 AU and voila, the
white line does through the data.
So this system has a solution of 1 Jupiter mass at 5 AU.
notice the sign
wave has disappeared and you can no longer detect the perturbing
planet under these worse conditions. In particular, the error is
too large, but also the time span is less than a full orbital period.
So the point is that for each combination of detector/observing parameters
there are systems that you can and cannot detect.
You can now go back to Step 3 (where your original solution still pertains); although the white line kind of goes through the data, there is too much variation and no one would believe this is a secure detection.
Your assignment is to now fit the other three stars, using the three combinations below, to either a) determine the model parameters or b) explain why the given system can't be detected in either Case I, II, or III.
Observing/Dectector Cases
Case I:
Case II:
Case III: