Found Exoplanets and Habitable Systems
Histograms: Below are several images of exoplanetary data plotted. What conclusions can you draw from
each graph based on what is plotted?

Mass distribution of stars with exoplanet(s)

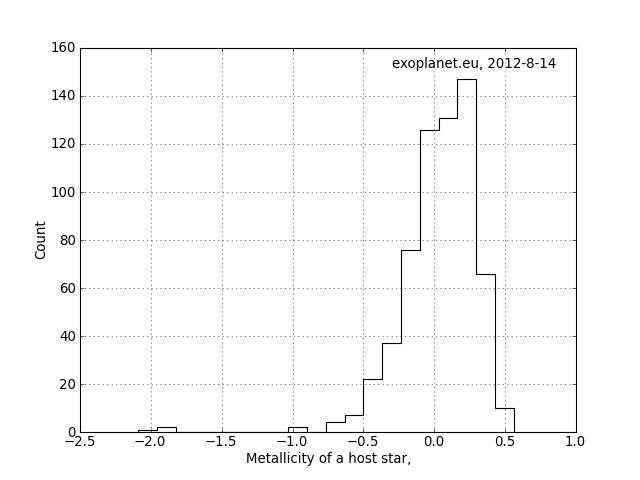
Metal distribution of stars.
NOTE: the numbers plotted refer to an index, negative numbers are stars with less metals in the sun,
0 are metal abundances similar to the sun and positive numbers are stars with more metals than the sun.

NOTE: 0 degrees means that the orbital plane of the system is perpendicular to our line of sight so that
we see the planet circling the star the for the entire orbit. 90 degrees means that the system is edge on and
periodically the planet goes behind the star.


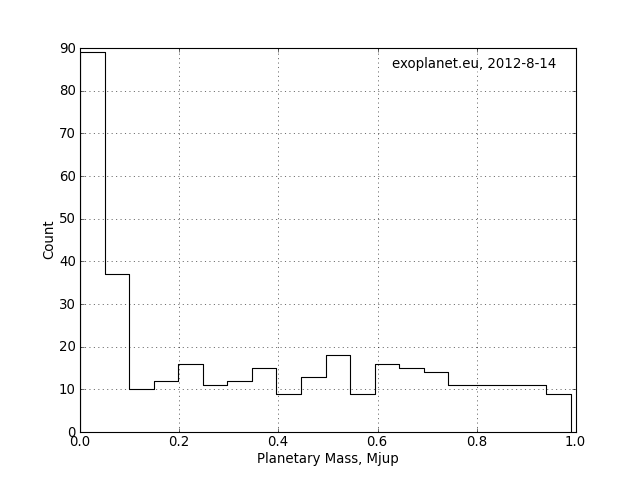
This is one plot
spread out to two plots for greater detail. The plot on the left shows the distribution of planetary masses
for planets upto 1 jupiter mass, the one on the right shows the distribution of planetary masses for planets
bigger than this.

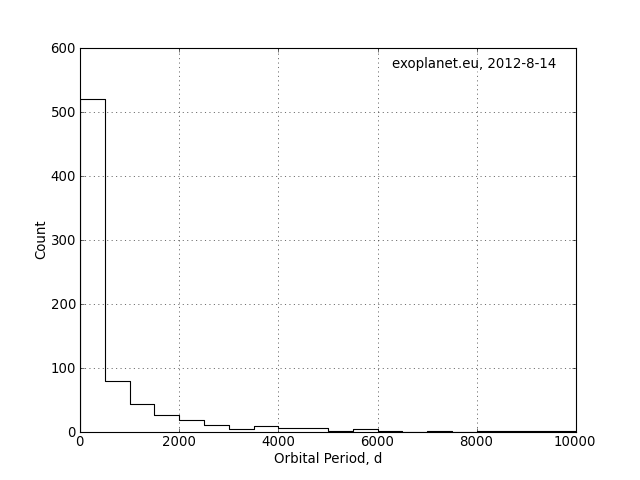
Distribution of orbital periods (the
year for each planet) in days.
Note that One Jupiter Year = 4331 days.
Question: Would you say these conclusions could be Universal or biased? Which ones are and which ones aren't?


