We can gather only two pieces of information of stars from images:
1) Apparent flux (measured in ergs cm-2 sec -1)
If we know the distance to the star (found by parallax measurements) we can calculate the luminosity.
From these two observations, a Hertzsprung-Russell (HR) diagram is made:
2) Color (flux ratio of two different filtered images)
which is a plot of the luminosity of a star (y-axis) versus its color. Color is a gauge of the stellar surface temperature, the details of which will be described below. The x-axis is reversed in the sense that higher temperatures, (hotter stars) are on the left and cooler stars are on the right. The Y-axis is luminosity in units of solar luminosities. The fact that there appears to be groups of points rather than a random distribution of data shows that there is a connection between the luminosity and the surface temperature, specifically all the points composing the diagonal strip of points (called the Main Sequence) must have the same internal characteristics. Essentially, this diagram is observational proof of the entire theory of stellar evolution. Now when we are making a plot of surface temperature vs energy output (stellar luminosity) we are plotting the two external attributes of stars that we get from observation. We didn't have to go to the star to get this information.
Its important to get a volume limited sample if you want a representative sample of stars.
Stellar temperature comes from measuring the B-V color of the star under the assumption that the star is a blackbody radiator (see more below)
How does color determine temperature? The surface temperature of a star can be approximated as a blackbody - mathematically
described by the planck function:
The key parameter in this equation is the temperature. Each temperature
corresponds to a unique spectrum of emission. Basically, for a given temperature the relative number of photons for each wavelength is unique.
The example below shows three blackbody curves each corresponding to three different temperatures. The y-axis shows the relative emitted amounts of energy emitted and the x-axis shows wavelength. The visible spectrum is shown for comparison. There are two clear fundamental properties of blackbodies:

Examination of these curves shows a fundamental experimental result. As you go to cooler temperatures, the wavelength at which the maximum amount of energy is emitted shifts to longer wavelengths.
The color is then the measured ratio of two different filtered fluxes expressed as an index (e.g. B-V, B-R, V-I, U-I, etc...).
The image below shows the outlines of the filter bandpasses overlying two different blackbodies (not to scale).
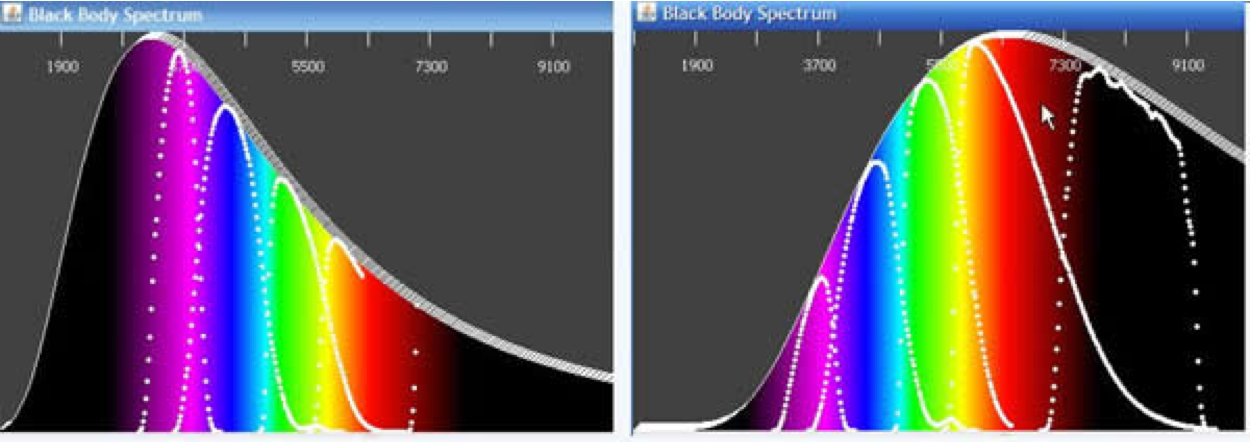 .
.
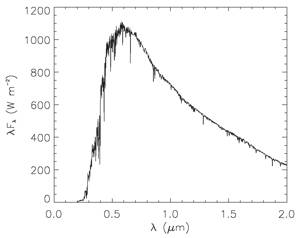
Real Stellar Spectra
Stars are only approximate blackbodies. They have absorption line features which we won't go into
but you can read more about it here.
You can see the blackbody continuum underlying the spectral features:
Core temperature is very sensitive to mass of the star. The hotter the core temperature, the greater amount of nuclear reactions take place in the core and the core fuel is used up at a much faster rate than a smaller star. This is necessary so that there is enough pressure to support against the gravitational collapse of the star. Thus stellar mass dictates the lifetime of a star. Big stars live shorter lives than smaller stars because they need to generate more pressure (higher fuel consumption rate) for greater mass. So what happens after a star runs out of fuel? the star contracts because not enough pressure is being generated in core to support the mass. The core heats to a higher temperature and fusion ignites in the layer above the core. A star is no longer part of the Main Sequence and evolves to the red giant stage. If you want to learn more about stellar evolution go here. The diagonal strip of data points you see on the HR diagram at the top is the "Main Sequence". And from the previous discussion can be thought of more as a mass sequence because the luminosity is heavily dependent on the mass. There are a lot of big concepts briefly mentioned in this section. Here is a quick summary of what is important about main sequence stars:
Massive stars evolve much more quickly than low mass stars. (defined as stellar lifetime)
These observations of binary stars form the basis for the empirical mass-luminosity relationship for hydrogen burning stars.
This relationship is shown below and it reveals the important empirical scaling between Mass and Luminosity.
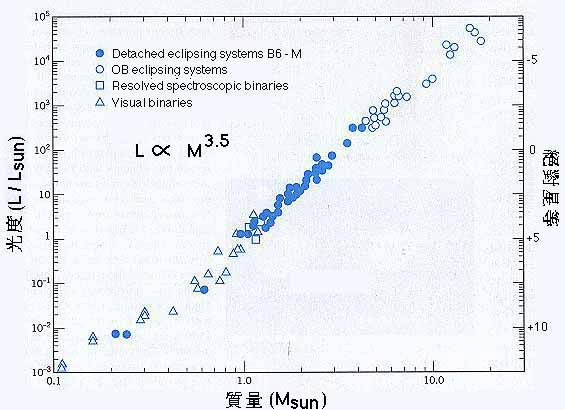
L goes as M3.5
What implication does this have for stellar lifetimes?
Well the lifetime of a star is equal to its total fuel (which is M), divided by the fuel consumption rate, which is the Luminosity of the star).
so lifetime goes as M/L which goes as M/M3.5 or M-2.5.
The calibrated relationship is, when M is measured in solar masses, the lifetime is:
Thus a 10 solar mass star would have a lifetime of only 30 million years.

Stellar Clusters are useful "laboratories" for testing our theories of star formation.
The galaxy has helped us out to some extent by creating stars in clusters, instead of creating them one by one in random places, at random times, under wildly varying conditions of temperature, density, and chemical composition.
Stars in a cluster formed at the same time, in the same
molecular cloud.
Therefore, stars in a cluster
Thus, when stars form within a cluster, they differ only in their mass. The more massive stars evolve more rapidly, so to find the AGE of a cluster of stars, we need merely determine the mass of the stars which have just now exhausted the hydrogen in their cores and are turning into red giants.
The first diagram is of a cluster which is only 1 million
years old. The cool K & M stars (stars with temperatures less than 5000K) have not yet settled down
onto the main sequence; they are still contracting
protostars, and have not yet ignited hydrogen fusion
in their cores. On the other hand, the hottest O star
has already evolved to a red supergiant (red dot).
 .
.
This would be about a 50 solar
mass star.
The next diagram shows the cluster at an age of
10 million years. Here the main sequence turnoff corresponds
to about a 10 solar mass star.
The next frame is of the cluster
that is 100 million years
old. The main sequence lifetime of a 6 solar mass star
is 100 million years, so stars with M = 6 Msun
(L = 530 Lsun, spectral type A) are just
turning off the main sequence.
The next frame shows the cluster at an age of 1 billion years,
which corresponds to the lifetime of a 2 solar mass star
(spectral type F). By this age, a few of the more massive
stars have no evolved to populate the white dwarf sequence.
The final diagram is of a cluster which is 10 billion years old. The main sequence lifetime of a 1 solar mass star is 10 billion years, so stars with M = 1 Msun (L = 1 Lsun, spectral type G) are just turning off the main sequence. All the stars on the red giant branch are more massive than 1 solar mass. More white dwarf stars are also present.
Good agreement with theory and observation comes from accurate measurements of fluxes and distances.
Flux is related to luminosity by F~L/d2
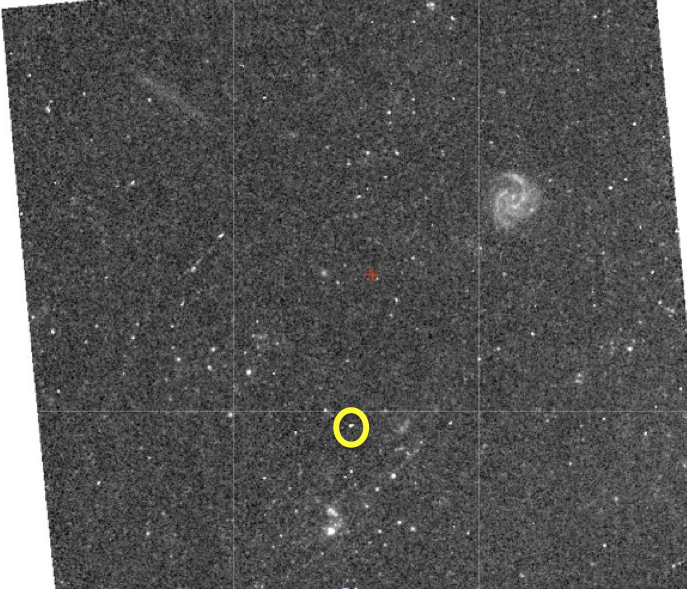
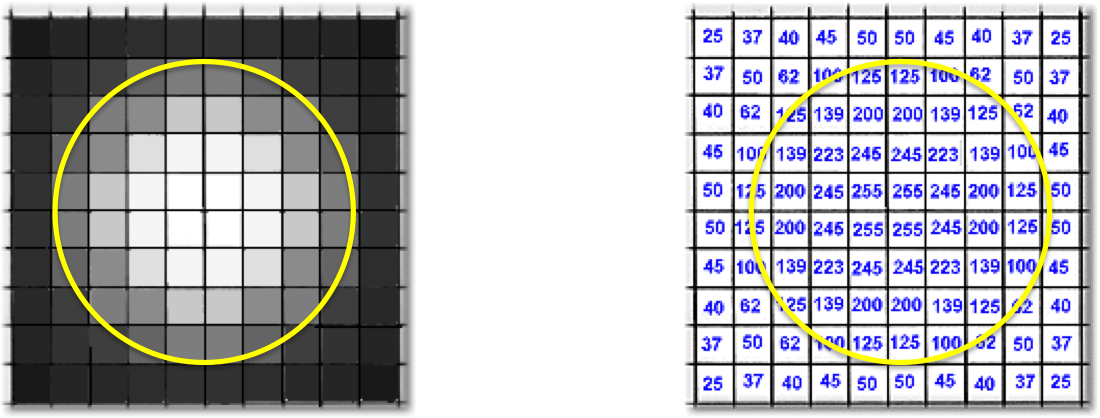
In practice, stellar flux from a CCD image is measured by counting
up pixel values within an aperture and subtracting the background sky noise.
Once we know the flux and distance, we know the luminosity. The color is the ratio of fluxes in two different bands. This is measured
in magnitudes which is a nonintuitive scale. Magnitude and flux are related by: m ~ -2.5log10(F/d2). For instance, the B-V color is:
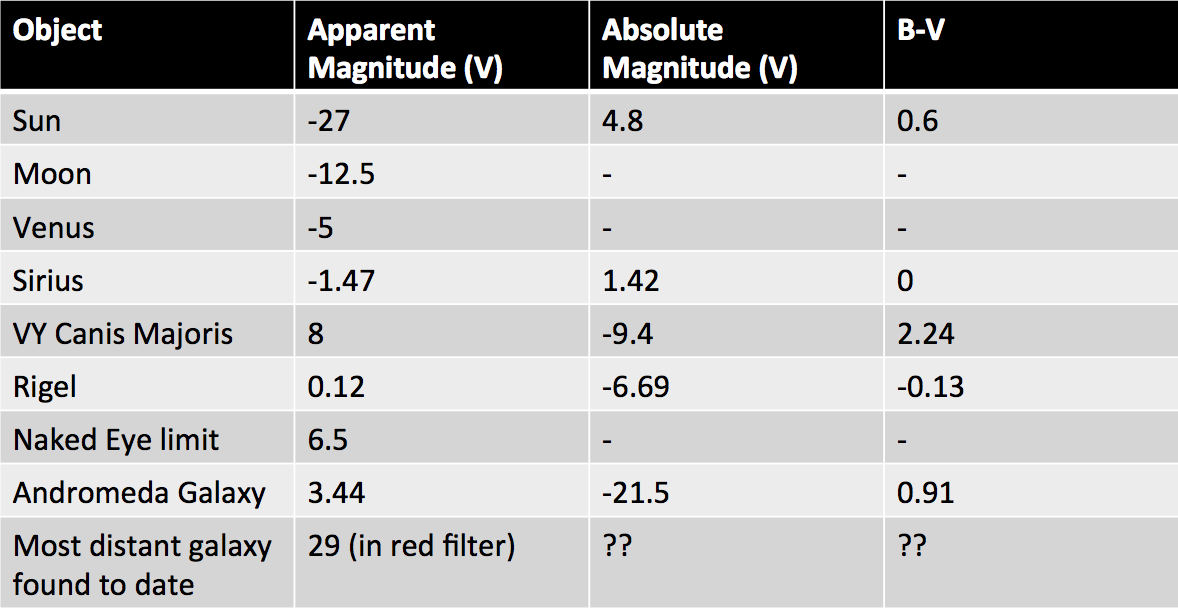
B-V = -2.5log10(FB/FV) where FB and FV are the fluxes measured in B and V filters. There is apparent magnitude and absolute magnitude. Apparent magnitude refers to the flux (magnitude scale of course) of any object measured at Earth. The absolute magnitude is
the brightness at a distance of 10 parsecs (1 pc ~ 3.2 light years or 2x10⁵ AU -earth sun distance or 3x1018cm) away.
Your lab covers more of these relationships. Here are some magnitudes and colors of various objects to give you a sense of the scaling: