Why this all matters:
Source of Quote:
By allowing citizens to view scientific data and explore climate change projections at any scale in their own neighborhood, we help them understand these often abstract phenomena at local, human scales. We believe this is a way to connect all stakeholders to this mutual problem, enhancing awareness, education, dialogue, and collaborative problem-solving at all scales of society and government.
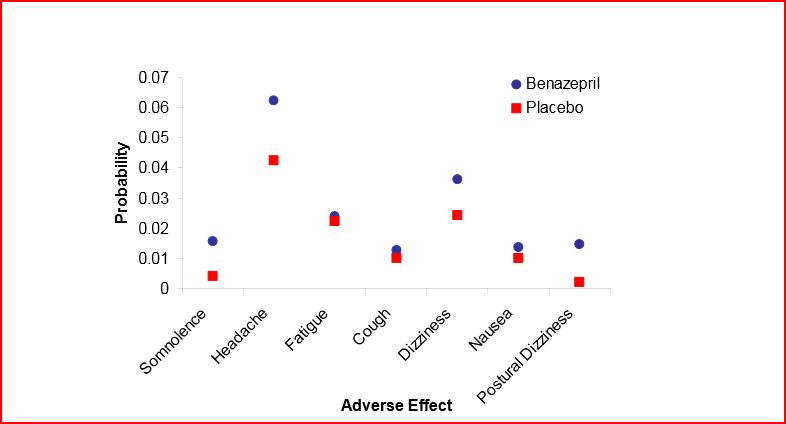
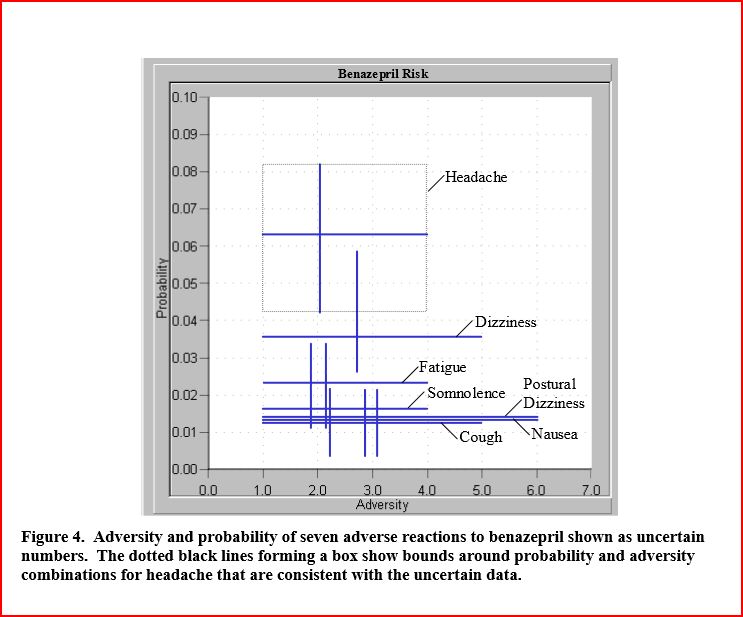
The following set of examples regards side effects associated with taking the drug benazepril.
We start with a numerical table - well proven not
to be effectively processed by humans:
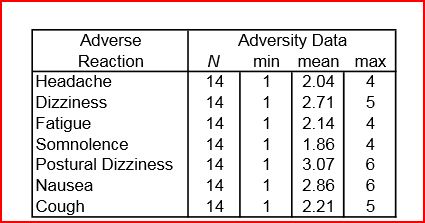
Now we turn that into some kind of graphic, which is
only slightly more effective:
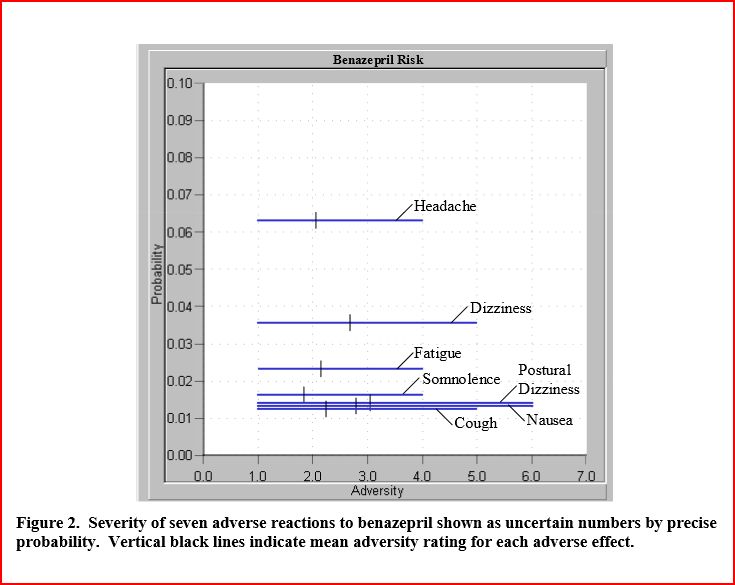
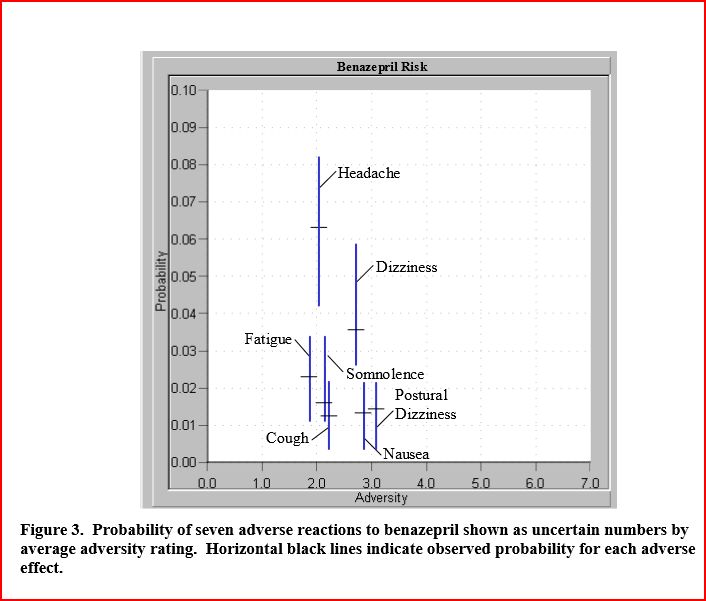
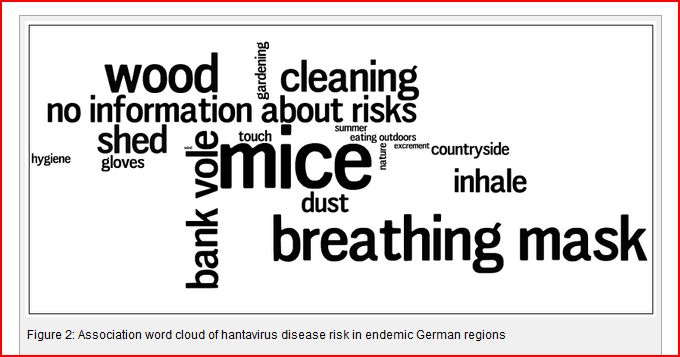
Here's the dreaded word cloud trying to be applied
in a public health sense.
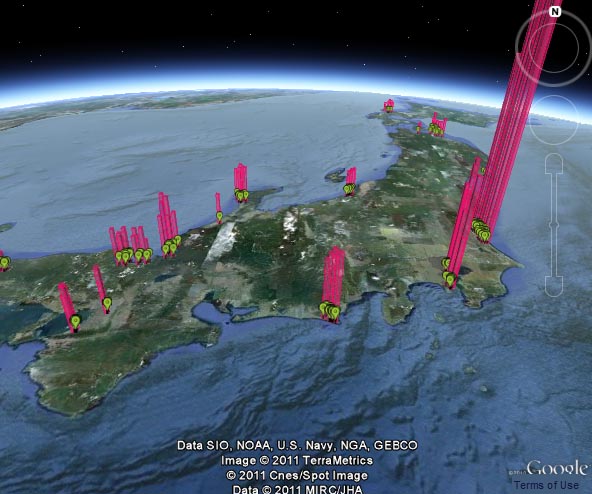
Finally, here is an example of something decent. After
the Tsunami/Fukushima Nuclear plant incident in Japan in 2011, individual Japanese citizens recorded levels of radiation at their location to producea crowdsourced radiation risk map. One representation of that data is here:
|
