In these notes we will present and consider other kinds of possible indicators of climate change. In many cases most of these other indicators will being to show a signal around 1980.
We begin with an area introduced last time: heat Wave deaths.
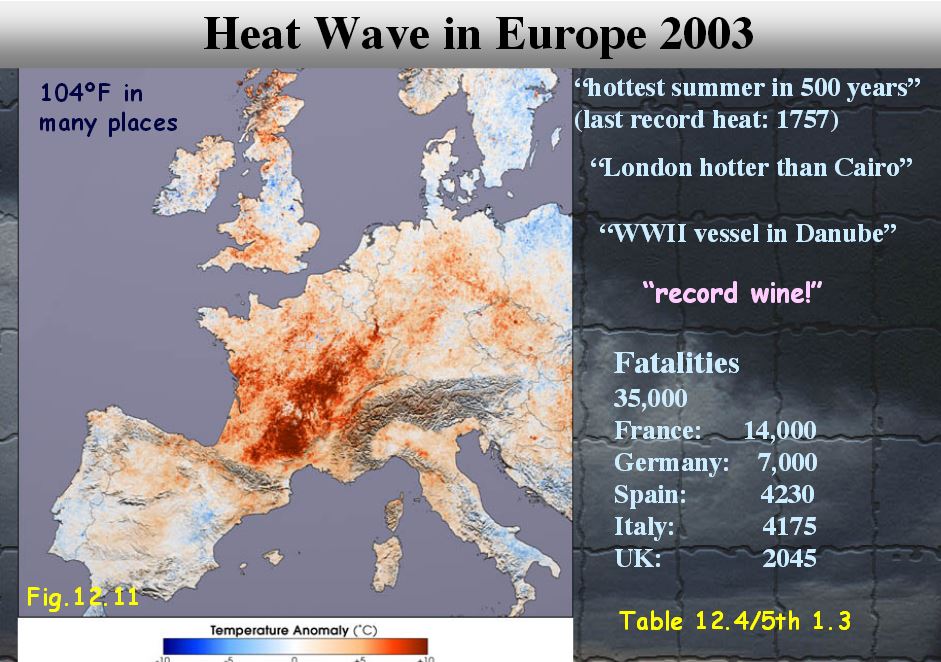
The figure below shows the situation in Europe in 2003, which
was unprecedented
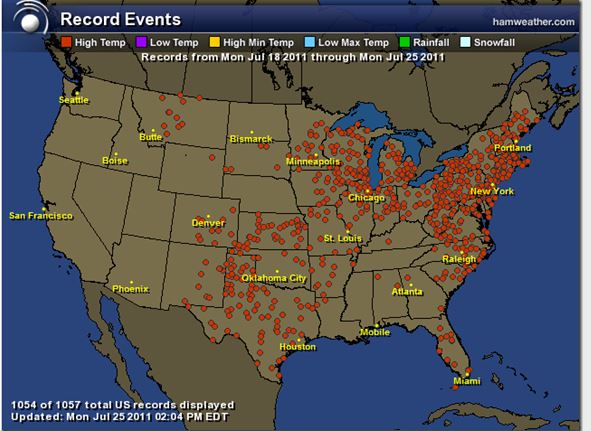
Here is a snippet of one week from June 2011 in which about 1050
individual record high temperatures were set. This just doesn't happen randomly:
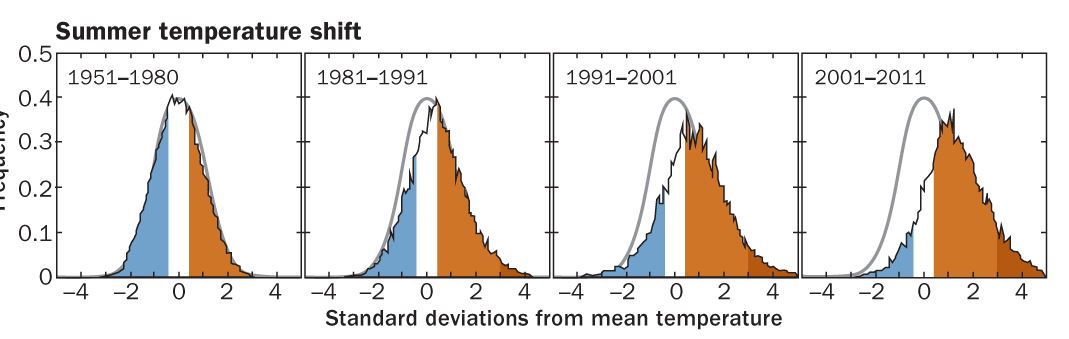
And here is the data that shows significant summer time temperature distributions that are strongly shifting away from
the 1951-1980 baseline distribution. This shift beyond 3 standard deviations is particularly noticeable for 2001-2011 compared to 1991-2001.
Another aspect of climate change is increasing volatility in
some climate indicator. Two examples are shown below, although the latter regarding total power of hurricanes is still a matter of some scientific controversy as its not clear that there is a reliable way to calibrate these measurements:
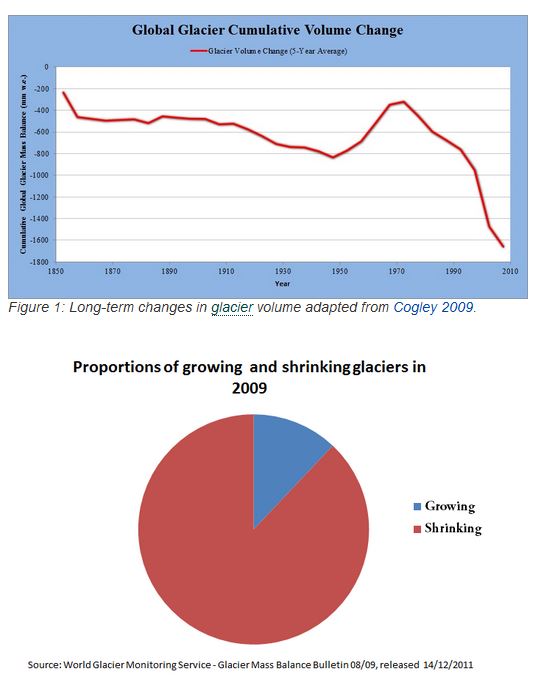
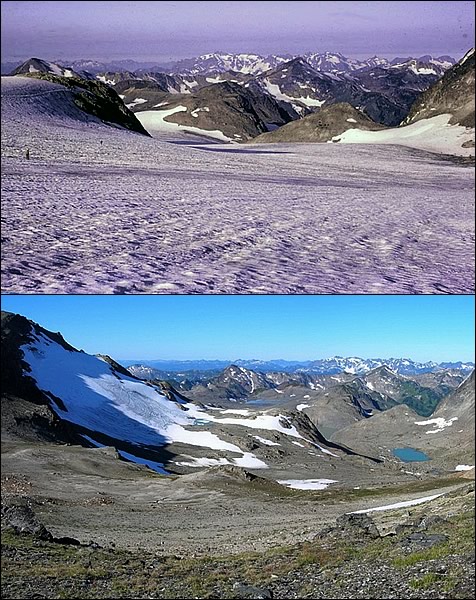
One of the most sensitive system components to climate change is the cryosphere (ice component of Earth). It is well known that the volume of glaciers is strongly being reduced. Now, since we do have glacial and inter-glacial periods on time scales of 15,000 years, this decrease is expected, but the RATE of decrease
is much larger than expected.
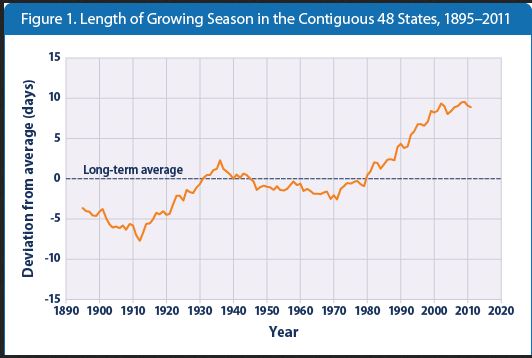
A potentially positive aspect of global climate change is shown below where it an be seen, that since 19980 the length of the growing season became longer and is continuing to lengthen up to
early 2000s and now appears to have flattened out. However, longer growing seasons also created a larger insect/pest problem.
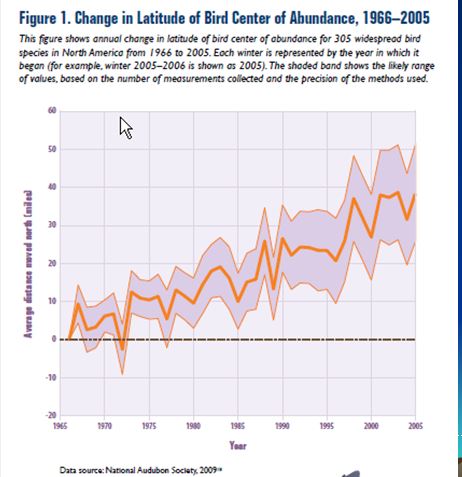
Significant latitude changes have now been observed for various migrating bird species. Those that used to congregate at equatorial latitudes now do so at latitudes between 30 and 40 degrees. This is a large shift relatively rapidly.
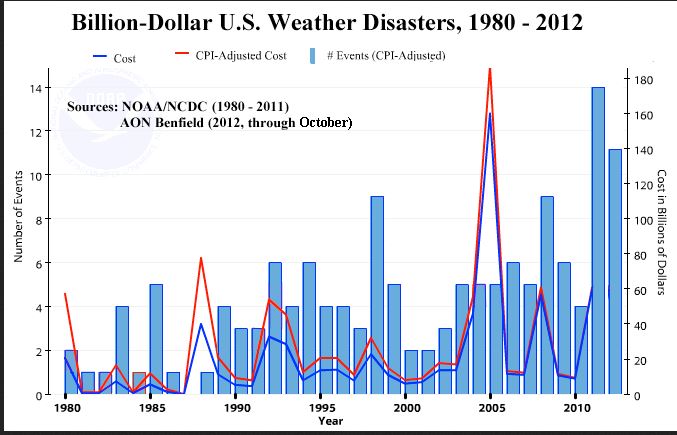
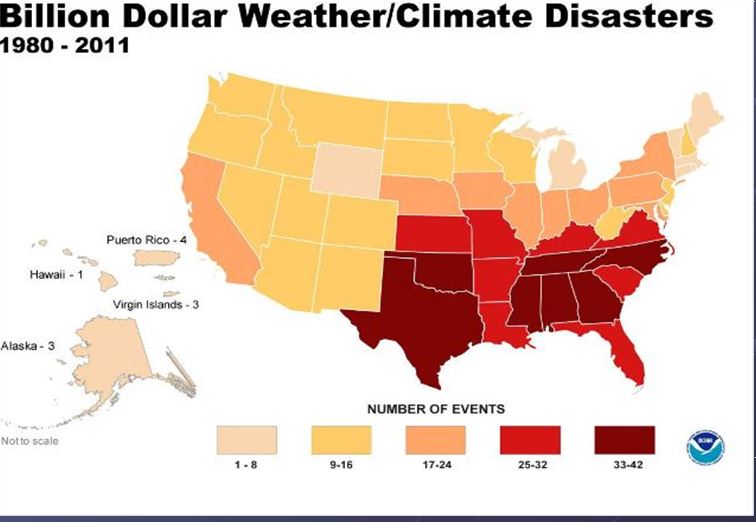
Finally, it is well known that the event rate of weather disasters (floods, hurricanes, fires, etc) that cause at least
1 billion dollars of damage is increasing with time and was particularly high in 2011 (14 individual events) and 2012 (11 individual events). It is these kinds of large scale weather
disasters that motivate people to move and the US might start
seeing waves of environmental refugees from certain hot spot
to disaster areas (e.g. does anyone really want to remain in
Oklahomy City following the latest gigantic tornado onslaught
in May 2013).
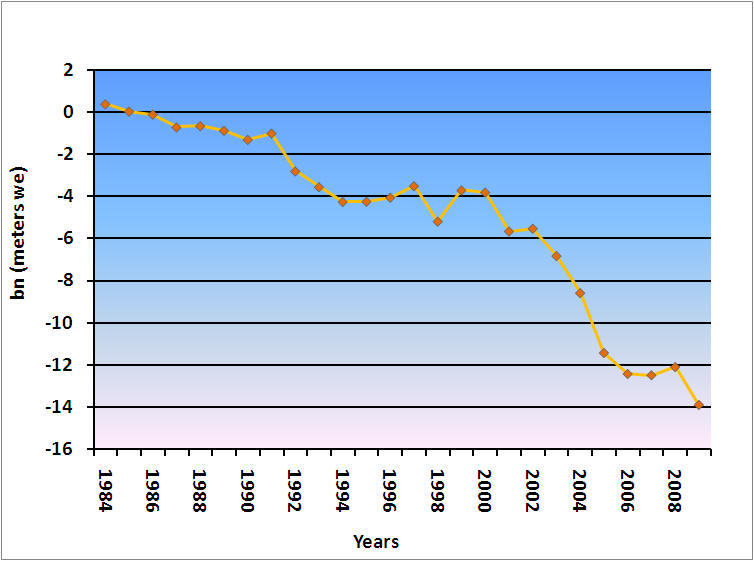
Locally the glaciers in the North Casacades have experienced a 30% loss in volume since first measurments in 1984. Rate of Loss seems to have accelerated starting in 2002 suggesting a tipping point has been reached: