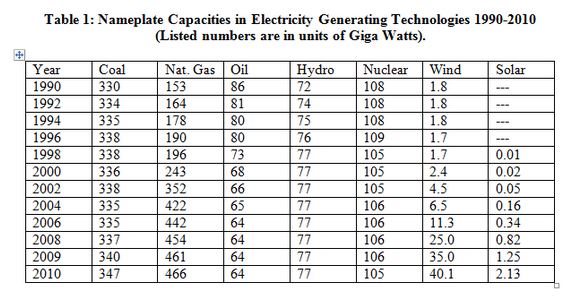
2012: 348 487 63 78 107 60 8
Capacity additions 2010 - 2012 = 24.25 GW = 2% increase in nameplate infrastructure.
- NG = 21 GW
- Wind + solar = .25 GW
- NG/(wind + solar) = 84 ~ 100; This is our REALITY
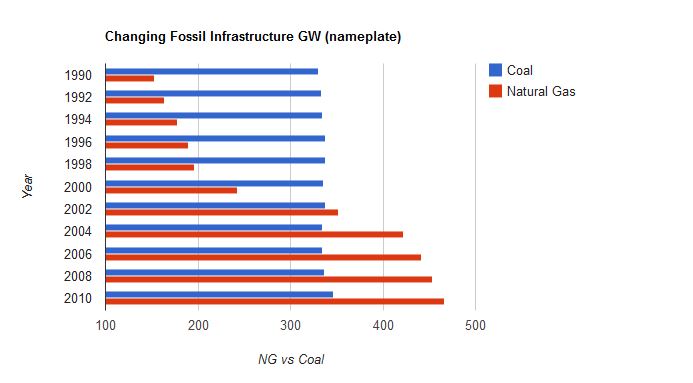
NG Clearly overtakes coal over the last 20 years

Update: From 2012-2018 Coal will retire about 60 GW of capacity
due to issues of new regulations and profitability.
NG has risen by about 40 GW since 2010 so around 500 GW now with a planned
rise of about 100 GW more out to 2018 (shale gas, fracking ,etc)
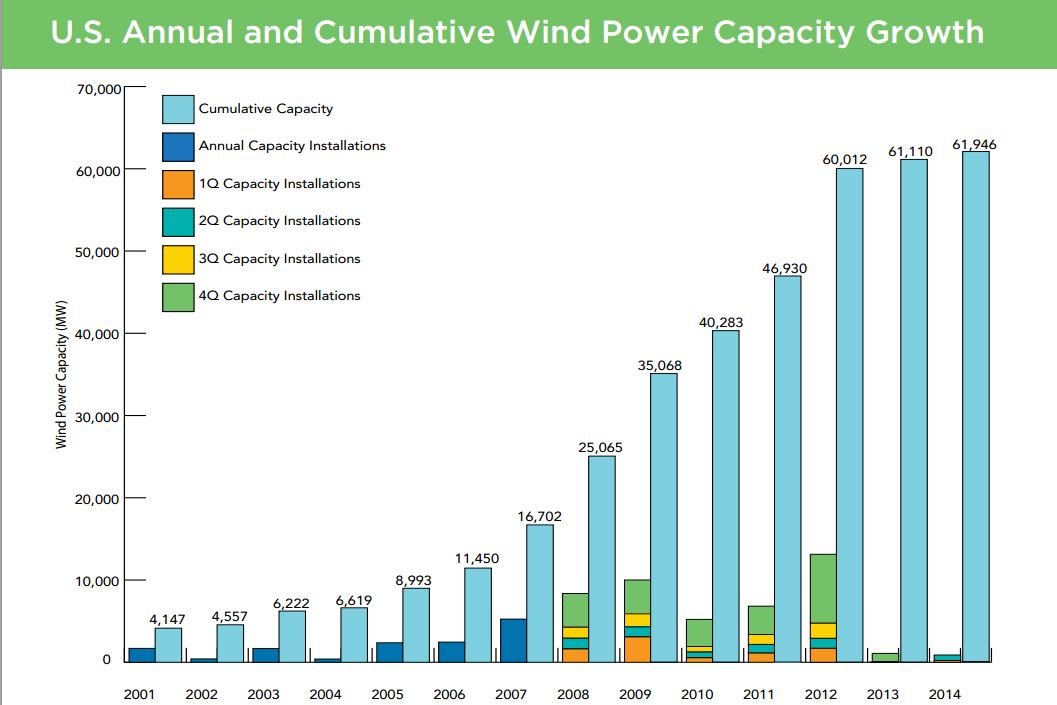
Wind has increased by 25 GW since 2010;
Wind energy is difficult to forecast for the future.

Important note: Capacity factor of NG is about 90% and Wind is about 30%  therefore total generation per nameplate is much higher for NG than Wind. However, nameplate
is still important because that represents an investment in infrastructure (we build the things)
that is independent of actual generation.
A sign of slightly changing times
|